
The August swoon in U.S. stocks felt like it came out of nowhere, but it was slowly in the making. The S&P 500 index (1939) peaked in May at 2135, with sideways action since February this year… NYSE margin debt peaked in April at just north of $507 billion ($473 billion in August)… Investors Intelligence bullish percent began to come under pressure from 57.4 in late April (26 percent this week)… And last but not the least, transportation stocks peaked as early as November last year (down nearly 16 percent since).
How things evolve at/around resistance can be a big telltale sign.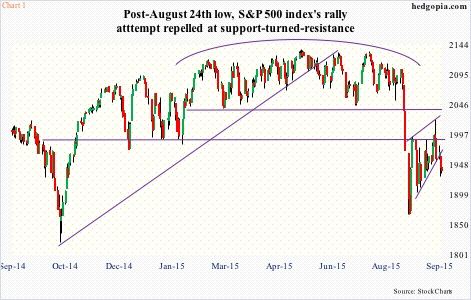
Toward the end of May, the S&P 500 broke down through the mid-October 2014 trend line, the underside of which subsequently provided resistance several times in the next one month. Come August, the index lost the all-important 2040 level, followed by 1990. Post-August 24th low, the index rallied strongly, but struggled at 1990, with an intra-day post-FOMC spike to 2121 meeting with a reversal. Subsequently, it fell out of a wedge (Chart 1).
The S&P 500 is not the only one trading in this fashion. On the Russell 2000, support at 1210 goes back to March last year, which was violated in August. Post-August 24th low, it fizzled out after rallying to 1194… On the Dow Industrials, 17,000-and-change has been an important support/resistance line going back to July last year. After losing it in August, the subsequent rally stopped at 16933… Last but not the least, on the Nasdaq 100, the 4300-4400 range has been an important level since last November. Once again, this was broken during the August sell-off and is now proving to be tough resistance.
As things stand now, there is nothing to suggest that sellers/shorts will stop showing up near resistance – as they just did. What bulls would like to have happen is at least a sideways action so they muster up enough strength to eventually take down the resistance. The only problem with this is the 200-day moving average, which is slightly pointing lower. In a sideways market, it will seriously begin to roll over. So bulls need a rally – soon. If bears win out the battle, it can problematic.
Several indicators are literally sitting on make-or-break levels. Further weakness in stocks would only speed up the downward momentum.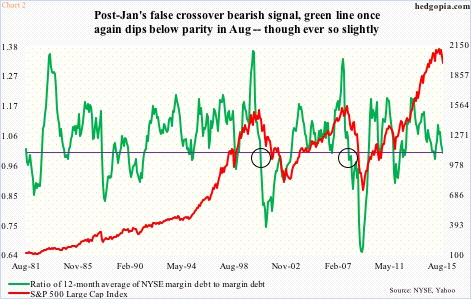
In Chart 2, the green line takes a ratio of 12-month moving average of NYSE margin debt to margin debt. Once the ratio sustains below one, stocks tend to come under pressure (as shown by circles corresponding to 2000 and 2008). In August, the 12-month average was north of $474 billion, resulting in a ratio of 0.999. Nothing serious. In fact, the ratio did drop below parity in January, but it snapped right back. For this to happen again, stocks need to stabilize. Margin debt fell 3.5 percent in July – an up month for stocks – and fell 2.9 percent in August. Failure for stocks to stabilize can cause margin debt to shrink, which in turn will put further downward pressure on stocks. A self-fulfilling prophecy!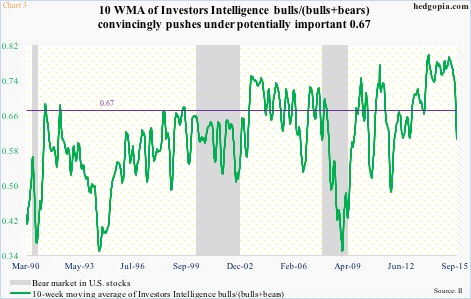
In Chart 3, the green line – the 10-week moving average of Investors Intelligence bulls/(bulls+bears) just pierced what could turn out to be an important level. If history is guide, once it drops below .67 from above, it is self-sustaining; this week, it dropped further to .61. As a matter of fact, bulls are already low – at 26 percent. But with bears at only 30.2 percent, the correction camp is rather huge – 43.8 percent this week and in the 40s the past eight weeks. In an ideal scenario, bulls’ count begins to rise, then putting upward pressure on the ratio. This is equity-friendly. But in the event stocks come under further pressure, there is plenty of room for neutrals to switch over to the bears’ camp. This is not equity-friendly.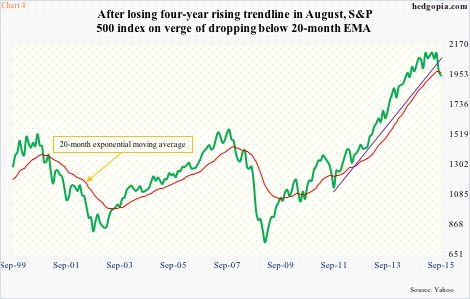
And finally, take a look at Chart 4. Hat tip to Michael Ashbaugh of Marketwatch who highlighted this in his Tuesday column. Chart 4 plots the S&P 500 with its 20-month exponential moving average. It is not too often the price crosses over or under the average. Once it does, it can signal a trend change. The last time the S&P 500 traded under the average was four years ago. And it could happen again. With five sessions remaining in the month, the index is 26 points below the 20 EMA of 1965.23. Not a whole lot. Nonetheless, it is another one of those indicators that are currently testing the mettle of bulls. Should the month close below the average, it would have come on the heels of a bearish monthly MACD crossover as well as violation of a four-year trend line.
In light of this, the significance of the August 24th low (1867) cannot be stressed enough. A violation can turn Charts 2/3/4 from ‘at inflection point’ to outright bearish.
Thanks for reading!
