
Two thousand and seventeen has gotten off to a good start. In the first nine sessions of the year, the S&P 500 large cap index is up 1.6 percent. For the most part, the rally is driven by offensive sectors/industries, with some exceptions, one of which is major.
Within defensives, XLV, the SPDR health care ETF, us up 2.9 percent, but XLU, the SPDR utilities ETF, is down 0.1 percent.
Within offensives, most have done well, with XLY, the SPDR consumer discretionary ETF, up 3.1 percent, XLB, the SPDR materials ETF, up 2.4 percent, and XLK, the SPDR technology ETF, up 2.7 percent.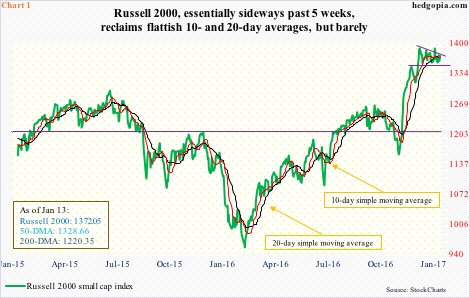
Small-caps, however, are lagging (Chart 1). The Russell 2000 small cap index year-to-date is up a relatively weak 1.1 percent. Contrast this with the Nasdaq 100 index, which is up four percent! So are we in a risk-on or risk-off environment?
In general, traders tend to gravitate toward both tech and small-caps in a feel-good environment. It is good if they are both rallying. Tells us markets’ appetite for risk-on at any given time. That is not the case now.
Since February 2014, the Russell 2000 had been range-bound – 1200 on the up and just under 1100 on the down. Along the way, there were range breakouts and breakdowns, but were proven false in due course. This changed in November.
Post-election, small-caps led, breaking out of the afore-mentioned range. President-elect Donald Trump’s victory apparently changed investor/trader sentiment.
Unlike large-caps, small-caps are inherently domestically focused. If comes to fruition, Mr. Trump’s planned tax cuts, deregulation, and infrastructure spending would largely benefit small-caps. That is the bullish argument – not just investors’ but also businesses’.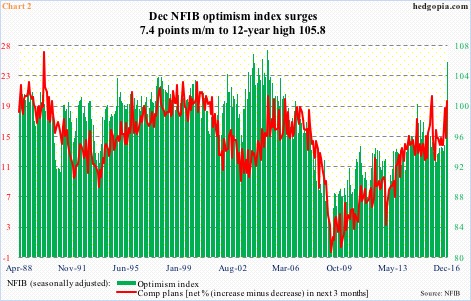
Small-cap business optimism surged to a 12-year high in December (Chart 2). To be clear, the NFIB optimism index had been rising since bottoming at 92.6 last March. Earlier, it had peaked at a cycle high 100.3 in December 2014. But the 7.4-point month-over-month jump in December is the highest ever (data goes back to January 1986).
With that said, has this surge in optimism translated into enhanced plans for capital expenditures and employment compensation? The short answer is ‘no’.
NFIB members’ capX plans jumped five points m/m to 29, but they were as optimistic in August 2014. Similarly, comp plans jumped five points to 20, but this did not even match the 21 of a year ago (Chart 2). Long story short, December’s reading can best be described as long on optimism and short on strategy.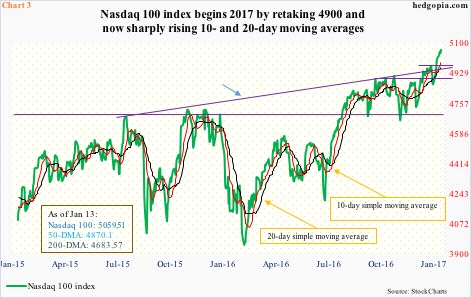
Might this also apply to small-cap bulls who have aggressively gone long in the past couple of months? Time will tell. But one thing is clear. Signs of fatigue are showing up. Small-caps have been sideways to slightly down for five weeks now. In the meantime, tech has outshone them.
The Nasdaq 100 has rallied in eight of the nine sessions this year. On December 30, it lost support at 4900, which has now been recaptured. Notice the sharply rising 10- and 20-day moving averages (Chart 3). Contrast this with the flattish on the Russell 2000 (Chart 1).
Post-U.S. presidential election, tech lagged and small-caps led, and now it is the opposite. Hence the question again, are we in a risk-on or risk-off environment?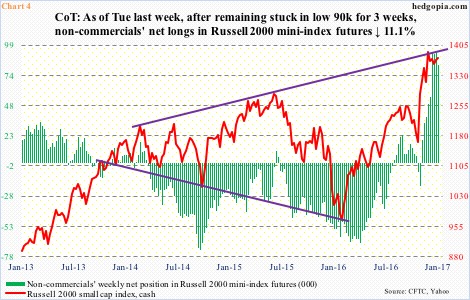
This is fine so long as small-caps are just taking a breather and begin to rally again. Sort of in a rolling rotation fashion.
When on December 9 the Russell 2000 made an all-time high 1392.71 it kissed – and was rejected by – a rising trend line from March 2014 (Chart 4). There is no breakout yet. The Nasdaq 100, by the way, faced similar resistance (blue arrow in Chart 3), and was able to break out.
What if the Russell 2000 is unable to do so?
The risk lies in the futures market.
Non-commercials have built up massive net longs in Russell 2000 mini-index futures, having switched from net short to net long in the week ended November 8 last year (election was held on that day). They were net short 18,999 contracts then. By January 3, they were net long 92,652 contracts. From November 8 through January 4, the Russell 2000 rallied 16 percent.
Here is the thing. As noted above, the Russell 2000 has gone sideways the past five weeks. From about that time through the January 3 record high, net longs jumped 88 percent. These holdings are just trading water.
With this as a background, what the small-cap bulls do not want to see happen is the Russell 2000 losing 1347. That was the high on November 25. The index then came under slight pressure, followed by a rally to a new all-time high of 1392.71.
Last Thursday, support at 1350-plus was lost intra-day but bulls stepped up to defend 1347, reclaiming the 10- and 20-day in the next session. But unlike on the Nasdaq 100, these averages look fatigued on the Russell 2000. If small-caps do not enter risk-on soon, this support might just give way, and with that 1347, thus tempting non-commercials to lock in profit. In the latest week, they did cut net longs by 11 percent to 82,410 contracts.
Thanks for reading!
