
U.S. real GDP grew at an annual rate of 2.9 percent in 3Q16, owing primarily to inventory buildup and increase in exports. The two respectively contributed 0.6 percent and 1.2 percent to real GDP growth. Real final sales to domestic purchasers only grew 1.4 percent.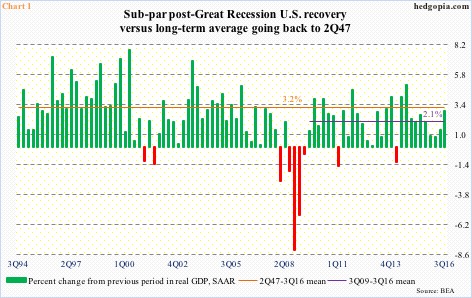
Of the 29 quarters post-Great Recession, only six have grown above the 2Q47-3Q16 average of 3.2 percent (Chart 1). That is how anemic this recovery has been, with the 3Q09-3Q16 average of 2.1 percent.
On the day GDP was reported – on October 28 – the 10-year Treasury yield rose to 1.88 percent intra-day but closed the session essentially unchanged at 1.84 percent. The bond market does not believe the 3Q16 GDP momentum is sustainable.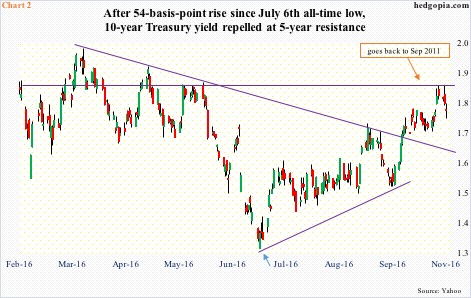
Over the past four months, the yield curve shifted up, with the 10-year yield rising from the all-time low 1.34 percent on July 6 to 1.88 percent on November 1, and the two-year from 0.56 percent on July 5 to 0.87 percent on October 27. This coincided with increased talk that the Fed was ready to hike.
Plus, technicals were oversold.
Nearly four months prior to the July bottom, the 10-year was yielding two percent on March 16. Yields then fell to that afore-mentioned bottom (blue arrow in Chart 2). At that low, momentum indicators were grossly oversold. Four months on, these oversold conditions have been unwound.
Daily and weekly indicators in particular are overbought.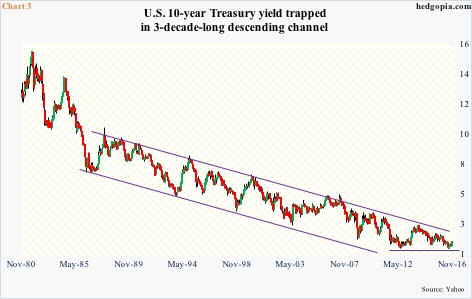
The 10-year has been in a multi-decade downturn. Yields peaked in September 1981 at 15.8 percent. Since 1986, it has been distinctly trading within a channel. The July low this year was a retest of the 1.39-percent low in July 2012 – hence no lower lows. Too soon to say if this is THE bottom. The 10-year is still trapped in a three-decade channel – probably a long way to go before a breakout occurs, given where macro is.
For now, as is, a rate hike in December is possible. Unless the October jobs report due out tomorrow is a disaster. Before the December 13-14 meeting, November’s jobs report would have been reported as well.
Even if the remaining two jobs reports are good, would the Fed sound as hawkish as it did in the wake of a December hike last year? Not likely. Back then, after a 25-basis-point rise to 0.37 percent – the first hike in more than nine years – the Fed was willing to raise four more times this year. Thus far, there has been none.
If we just focus on data, the Fed funds rate probably needs to be a lot higher. The economy has expanded for more than seven years. Nearly 14 million non-farm jobs have been created. The unemployment rate has dropped from 10 percent in October 2009 to five percent (dropped to 4.7 percent in May this year.) GDP growth is subdued, but has been averaging 2.1 percent.
But here is the problem, things are in deceleration.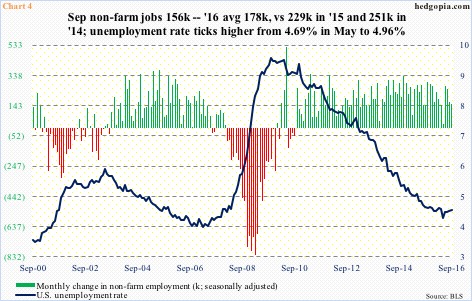
In the first nine months this year, non-farm payroll averaged 178,000, down from a monthly average of 229,000 in 2015 and 251,000 in 2014 (Chart 4). Capacity utilization was 75.4 percent in September this year, down from the cycle high 78.9 percent in November 2014. The NFIB optimism index (small business) peaked at 100.3 in December 2014 and stood at 94.1 in September this year. Orders for non-defense capital goods ex-aircraft – proxy for business capex – peaked in September 2014 at a seasonally adjusted annual rate of $70.7 billion, with September this year at $62.9 billion. And so on and so forth.
As much as the Fed wants to hike – and fill its monetary quiver with arrows – it is in a tight spot. In the meantime, with a 54-basis-point rise in four months, the 10-year has priced in a lot, raising odds of a reversal.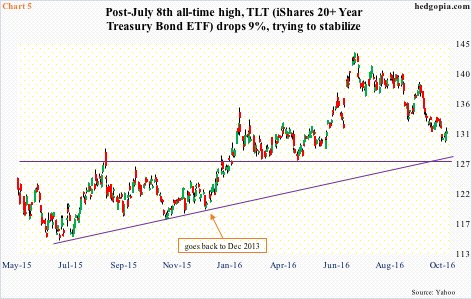
Enter TLT, the iShares 20+ year Treasury bond ETF. It reached an all-time high of $142.57 on July 8, before coming under pressure. From that high through the October 27th intra-day low of $129.82, it fell just under nine percent, which pushed the ETF below both 50- and 200-day moving averages. The October 27th low was made just outside the lower Bollinger band. Momentum indicators are in oversold territory.
At least in the near term, odds of a TLT ($131.58) rally have grown, even as the 10-year yield seems to want to go lower. In a worse-case scenario, the ETF can drop to test a rising December 2013 trend line around $127 (Chart 4). Hence the dilemma – go long the underlying now or wait for that test to occur?
Options can help. November 11th TLT 131 puts fetch $1.16. A short put, if assigned, ensures going long the underlying at $129.84, near last week’s low. Else, it is a nice premium to keep.
Thanks for reading!
