
Later this morning, we get revised and detailed estimates of December’s durable goods data. The preliminary numbers were released last week, and there was no change in the trend.
The trend is anything but going in the right direction.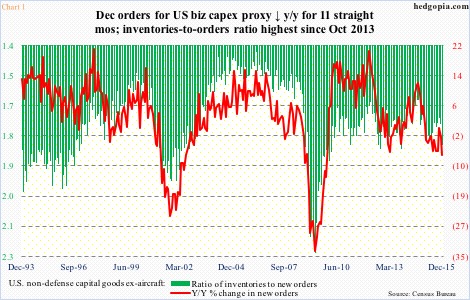
Orders for non-defense capital goods ex-aircraft – proxy for business capital expenditures – peaked at a seasonally adjusted annual rate of $74 billion in September 2014, before beginning a downward trend. By last December, orders had dropped to $65.9 billion – down $8 billion from the peak.
Such has been the force behind downward momentum that orders have dropped year-over-year for 11 consecutive months. The December decline of 7.5 percent was the sharpest since November 2009. Chart 1 also shows a ratio of inventories-to-orders, which, at 1.82 last December, was the highest since October 2013.
Either way you cut it, momentum is acting in reverse, and it is not something that can turn on a dime. At least from the perspective of year-over-year growth, odds are January, when it is reported, will be another down month.
This is because, after orders peaked in September 2014, they continued to come in the $70-billion range until January last year. It was only in February that they dropped to the $67-billion range. That said, orders will need to rise at least 2.3 percent month-over-month this January to register positive year-over-year growth. This may just be expecting a little too much given recent trends.
The progressive deterioration in this metric is not in isolation. Weak capex trends have been the mainstay of the post-Great Recession recovery.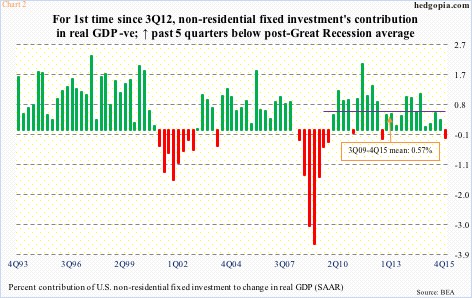
Chart 2 highlights the percent contribution of non-residential fixed investment in real GDP. In 4Q15, it took away 0.24 percent from growth – the first subtraction since 3Q12. Further, in the 26 quarters since the end of Great Recession, non-residential fixed investment has contributed an average 0.57 percent to GDP growth, which is weaker than in past cycles. And in the past five quarters, it has averaged below post-Great Recession average.
The signal coming from National Federation of Independent Business members’ capital expenditure plans is no different. The green bars in Chart 3 peaked at 29 in December 2014 – a seven-year high. One year later, this had decreased to 26 – not massive deceleration, nonetheless is important for two reasons. (January’s numbers will be published next Tuesday.)
One, it peaked at around the same time the red line in Chart 1 did. Two, NFIB members continue to have subdued capex plans even as their compensation plans have shot up of late. In December, the red line in Chart 3 came in unchanged sequentially at 20, matching the November 2006 reading. Historically, however, the two tend to move together.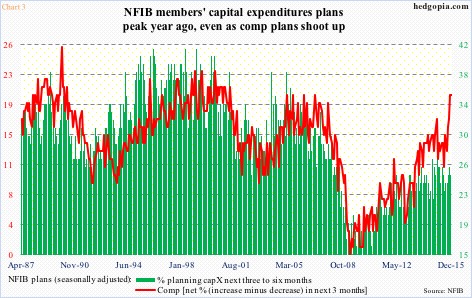
Which one should we treat as a signal? Or, what exactly is Chart 3 trying to tell us – that a capex surge is around the corner?
Probably not.
Since Great Recession ended, we have been constantly told about impending capex revival, which is yet to occur. An amalgam of data suggests no change in the status quo is imminent – not anytime soon anyway.
Odds strongly favor the red line in Chart 3 follows the green bars lower. And capex-revival hopes remain just that – hopes.
Thanks for reading!
