
 Non-residential fixed investment contributed 0.68 percent to the four-percent growth in U.S. gross domestic product in the second quarter. A much larger 1.69 percent came from personal consumption expenditures. Back in 1Q08, non-residential fixed investment peaked at $1.99tn, preceded by PCE one quarter earlier at $10.08tn. By 2Q14, they surpassed those peaks by 4.1 percent and 8.2 percent, respectively ($2.08tn and $10.91tn). In the current recovery, PCE’s share in nominal GDP has gone from 67.5 percent in 4Q07 to 68.6 percent in 2Q14, and non-residential fixed investment from 13.4 percent to 12.5 percent. Increasingly, the economy is reliant on personal consumption more than on business investment. The irony is, the longer this continues, the higher the risk that the balance sheets of consumers continue to stay stretched, or worse, deteriorate. Yes, there has been some progress in balance-sheet repair, but not a whole lot. Total liabilities of households and non-profit organizations peaked in 3Q08 at $14.58tn, and by 1Q14 dropped to $13.78tn. Looks like progress, until one realizes that the liabilities doubled since 1Q00. Hence the cautious U.S. corporates when it comes to willingness to press on the capital-spending accelerator. This was the message delivered in the inaugural piece on this blog, back in April. Nothing has changed in this respect.
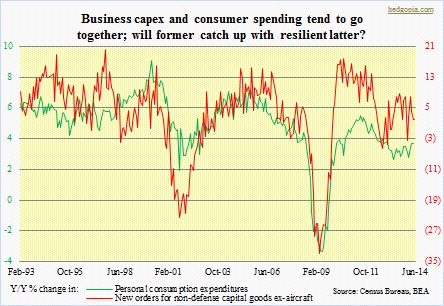
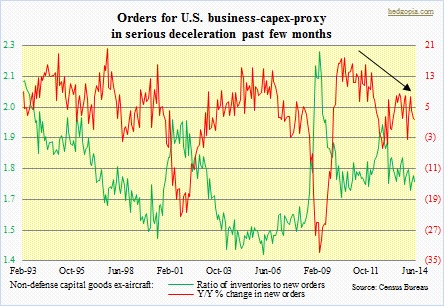 As the chart above shows, in normal circumstances business capex and consumer spending tend to go together. Since February, there has been a slight acceleration in year-over-year growth rate of consumer spending, which has yet to be fully reciprocated by business. In Fact, of late they have gone in the opposite direction. It is not like U.S. corporates lack the wherewithal. Profits after tax (with inventory valuation and capital consumption adjustments) in 2013 were $1.63tn, versus $976bn in 2008. The balance sheet is rich in cash, yet this is just one side of the coin. The bigger issue is debt. Total liabilities of non-financial corporates were $15.9tn in 1Q14, versus $12.9tn in 4Q09. In an environment in which sales growth is lacking, more and more companies rely on financial engineering in order to boost the bottom line, and that means stock buybacks. From a corporate treasurer’s perspective, real interest are zero, especially at the short end, and that is too good an opportunity to pass up. Hence the accumulation of debt, which does not get invested in capital stock, rather spent on dividend payouts and stock buybacks. This obviously gets reflected in orders for non-defense capital goods ex-aircraft, a proxy for business capital spending. Year-over-year growth is in serious deceleration since March – from 7.89 percent to 1.89 percent in June.
