
- Subdued corporate capX now will adversely impact productivity later
- First time in 6 years, U.S. non-financials corporate capX exceeds internal funds
- Given new energy dynamics and impact on capX, too early to back-slap and high-five?
U.S. corporations have not been very aggressive when it comes to capital expenditures this cycle. This is no news. Memories of the booming ‘90s are too fresh, and we keep comparing. And things keep coming up short. Versus then, comparisons are not even close. Even though the current recovery is into its sixth year.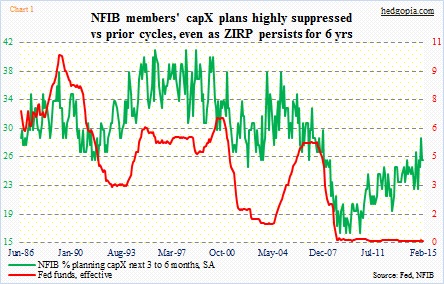
Chart 1 depicts National Federation of Independent Business members’ capX plans for the next three to six months. Since the mid-‘90s, the green line has consistently made lower highs. The recent high was December last year (29); February was three points lower. One would think the fact that ZIRP (zero interest-rate policy) has been in effect for six years now would stimulate things to unprecedented levels.
Truly, do we have ZIRP because economic activity is suppressed, or the economy is sub-par because we have ZIRP? Cause and effect confusion! The correlation between NFIB comp plans and the Fed funds rate has broken down since ZIRP got instituted. Between December 2008 and February 2015, R is negative 0.58, versus positive 0.64 between January 1986 and February 2015.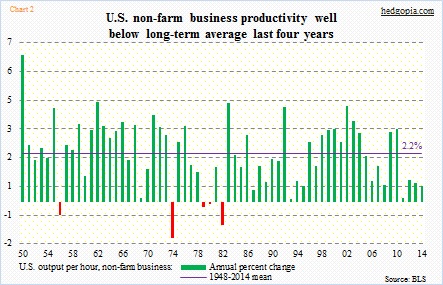
One wonders how this might impact labor productivity in outer years. Once again going back to the ‘90s, for eight years between 1993 and 2000, non-residential fixed investments grew substantially above average. The 1930-2014 mean is 4.7 percent (Chart 3). In those eight years, investments surged an average of 9.3 percent. The payoff was realized a few years later. Non-farm output per hour between 1996 and 2004 grew 3.1 percent, much faster than the 1948-2014 mean of 2.2 percent (Chart 2).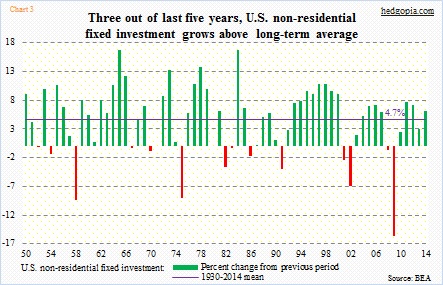
Between 2003 and 2007, growth in non-residential fixed investments averaged 5.4 percent, primarily due to outsize 2005 and 2006. This was better than the long-term average but much weaker versus the ‘90s. In the meantime, productivity the past four years has been an abysmal 0.68 percent, even though 2009 and 2010 were much better than the long-term average.
Most recently, during the past five years (2010-2014), non-residential fixed investments have averaged 5.3 percent. This is identical to what we had in the 2003-2007 period, which was followed by lousy productivity in recent years. Are we then looking at continuation of recent productivity trends in the years to come? One wonders.
If the trend persists, this probably puts unit labor costs under upward pressure.
Amidst all this, there is some ray of hope.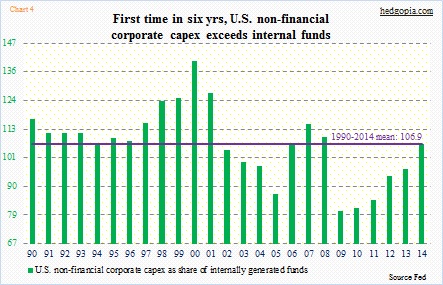
Chart 4 shows if U.S. non-financial businesses have been investing more/less than their internally generated funds, which are profits after tax adjusted for dividend payments and depreciation. ‘Foreign earnings retained abroad’ are not included in the calculation.
CapX bottomed in 2009 at $1 trillion, and has grown in each successive year. Since the recovery began in 2009, capX has lagged internally generated funds. That dubious record was broken last year. In 2014, these internal funds were $1.58 trillion, versus capX of $1.68 trillion. Going back to 1990, capX’s share of internal funds has averaged 106.9 percent, which is where 2014 came in at.
CapX grew 10-plus percent last year. To see these corporations invest more than they generated internally is a hopeful sign. With some reservations. The catch in all this is energy. The impact of the collapse in crude price was not felt last year. It will be felt this year.
So in normal circumstances that outermost green bar in Chart 4 would deserve backslapping and high fives, it is probably too soon for that given the new energy dynamics.
