
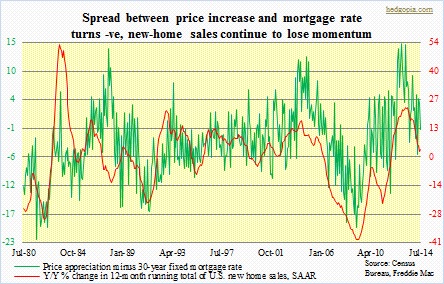
 The piece yesterday on U.S. housing was based on June’s numbers. New-home sales data came out yesterday, and it was anything but encouraging. Year-over-year, sales (seasonally adjusted annual rate) rose 12.2 percent but fell 2.4 percent month-over-month. The latter helps us gauge near-term momentum. Sales dropped in every region except the South, which accounts for more than three-fifths of the total. Year-over-year, the 12-month running total is still rising – up three percent in July – but the momentum has clearly shifted downward, as denoted by the red line in the adjacent chart. The culprit? Probably the green line. Of the two components used to calculate that metric, price is clearly struggling. Median price of a new house increased 2.9 percent y/y to $269.8k in July, clear deceleration from an increase of 8.7 percent in May. Back in August last year, price was $255.3k. Hence even if price stays unchanged m/m this month, it would have risen over five percent y/y. Beginning September, though, it will be increasingly difficult to have positive y/y change, as for the next nine months price never dipped below $264.3k (October 2013) and rose all the way to $286.6k (May 2014). Lesser appreciation in price – let alone negative – only results in that green line continue lower. This is assuming the 30-year fixed mortgage rate stays near the July level of 4.13 percent. If mortgage rate begins to rise, the spread between the two components goes even more negative. Provided the correlation between the two lines holds, this suggests continued softness in sales of new homes.
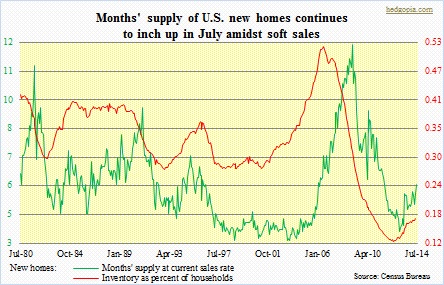 There are tons of reasons – some we discussed yesterday – leading to weak, or weakening, sales. Of which the dynamics between price and mortgage rate is a crucial one, as both relate to affordability, or a lack thereof. If what a mortgage costs is lower than by how much the price of a home appreciates, then it makes sense for an investor to take out a mortgage. Such an investor would rather prefer staying on the sidelines currently. Going by how things are shaping up on the price front, this should continue to be case in the months ahead. If these concerns are borne out, then this will have implications for the overall economy. In the big scheme of things, new-home sales are a small part of the overall housing picture. In July, existing-home sales (SAAR) were 5.15mn, versus 412k new homes sold. Both trigger consumption, but the latter is important in that home-building spurs economic activity. From this perspective, builders are optimistic, and inventory of new homes is inching up. ‘Months’ supply at current sales rate’ increased in July to six. This metric stood at 3.9 in January 2013, but was a bubbly 12.2 in January 2009. Furthermore, it is possible buyers are switching to previously owned homes as they tend to be cheaper than newly built homes. If there is truth to this, then the green line in the accompanying chart has more to go on the upside.
