
After weeks of staying subdued, there was some spring in volatility’s feet this week. Will it last or peter out as has been the case for the umpteenth time post-election?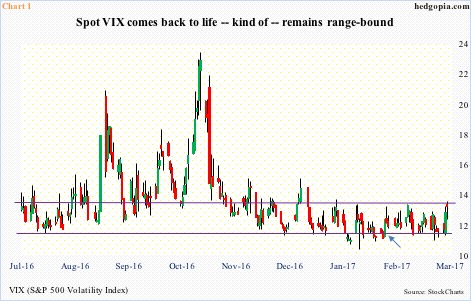
Tuesday’s 10-percent rally in spot VIX (12.81) was the largest daily move since the 11.5-percent jump on February 15 this year (arrow in Chart 1). Back then, VXX, the iPath S&P 500 VIX short-term futures ETN, pulled in $128 million, but there was no follow-through. Volatility peaked the very next session – not able to break out of the range.
On Tuesday, $136 million moved into VXX, preceded by inflows of $52 million on Monday. But VIX remains range-bound. For VXX to continue to attract money, VIX probably needs to take out the 200-day moving average. The last time it closed above that average was November 8 last year, the election day. The average was 15.7 at the time, and rapidly dropping. Now, it is two points lower (13.55), but flattish to slightly lower. So from this perspective, odds are better this time.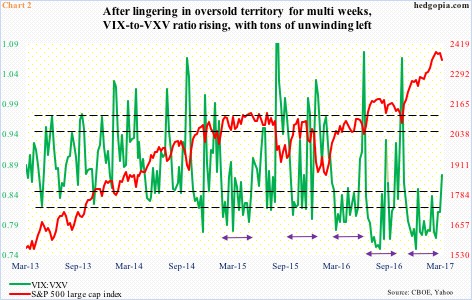
In this scenario, the VIX-to-VXV ratio continues to push up. As of Wednesday, the ratio stood at .873, up from .81 last Friday, and has plenty of room to continue higher before entering overbought territory.
The latest attempt to rally follows sideways action during which VIX:VXV lingered in high .70s/low .80s in 14 out of last 17 weeks. At least going back a couple of years, there have been four such multi-week, extended periods (bi-directional arrows in Chart 2), and in due course they all resulted in a spike.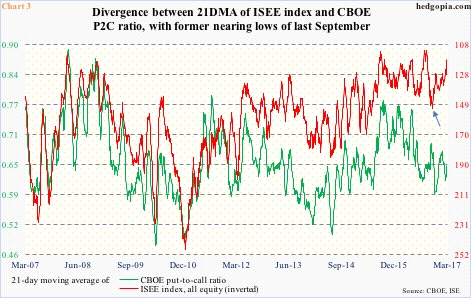
And then there is this.
It is next to impossible for all the indicators out there to move in sync. Some do, some don’t – just the nature of things. The trick is figuring out which one should be given how much weight. This is particularly so post-financial crisis as the Fed put helped distort many a signal. Now, we are beginning to hear of a Trump put.
President Trump’s promises to cut taxes and regulations as well as increase infrastructure spending have created a floor underneath equities. In this context, how VIX behaves near term could be telling.
If we are to only go by the red line in Chart 3, VIX will have trouble sustainably breaking out of the range it is in, which means VIX:VXV will struggle to rally.
Chart 3 presents equity put-to-call ratios. The ISEE index, in fact, is a call-to-put ratio, hence inverted. It excludes trades from market makers and broker/dealers, and only uses opening long trades. So versus the CBOE put-to-call ratio the ISEE index is considered a clean number.
In general, the two tend to move in tandem, but began to diverge post-election. The red line moved lower although equities were rallying hard, and it is now nearing the all-time lows from late September last year. What is the message here? That equities will rally soon? Or is the CBOE put-to-call ratio sending the correct signal, which is in no man’s land?
The answer once again may come from Chart 1. Depending on whether or not it manages to break out will decide equities’ fate – at least near-term. The indicator to follow at the moment.
Thanks for reading!
