
As expected, Fed Chair Janet Yellen, in her Humphrey-Hawkins testimony yesterday, reiterated what she, and other Fed officials, have been saying for a while. They are data dependent, and if data cooperate, a rate hike is coming later this year. It is a different matter altogether that the bond market continues to remain out of sync with the message coming out of the FOMC.
The 10-year Treasury yield yesterday fell two percent to 2.35 percent. Daily technicals were overbought, and that may have something to do with it. TLT, the iShares 20+ Year ETF, which was oversold, jumped 1.1 percent to 117.30.
As far as TLT is concerned, it could also be a ‘buy the rumor, sell the fact’ phenomenon. Market participants were waiting to hear what comes out of the Fed chief’s testimony. Once that was out of the way, buyers showed up.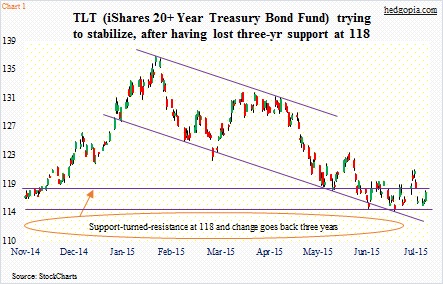
Technically, the ETF was already sitting at a crucial stage. A month and a half ago, it lost support at 118 and change. That support goes back three-plus years. After that breakdown, it stabilized around 115. Buyers showed up twice near the lower range of the January 2015 down trending channel (Chart 1). The 114.64 low is important.
The question is, is there more upside left in TLT – at least near-term?
Near- and medium-term technicals are oversold. The ETF is currently sitting right underneath that support-turned-resistance, and it is probably just a matter of time before that breakdown gets retested. Right around there lies the 50-day moving average (118.44). For bond bulls, the good thing is that after that breakdown, things did not get out of hand; as well, the January channel support held.
Some other technical factors could be at play as well.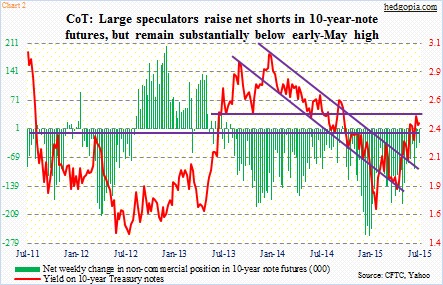
In the July 7th week, non-commercials raised net shorts in 10-year-note futures, but their conviction was substantially less versus as early as May or last December. Early May, they held 183,000 net shorts, which dropped to 3,500 contracts at the end of June, before rising to 33,000 last week. At the end of last December, they held even more – 261,000 (Chart 2). During the period, TLT dropped from 124.37 to 117.22; 10-year yields rose from 2.17 percent to 2.34 percent. In this instance, they clearly got the direction wrong. So it is probably not right to give too much weight to how these traders are positioned. Nonetheless, it is worth paying attention to.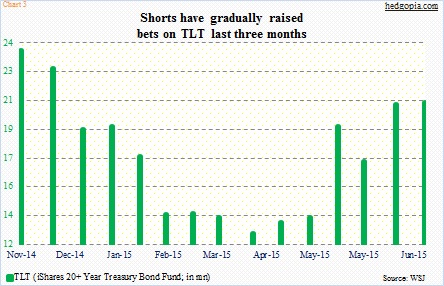
If bond bulls are able to retake 118-plus, then short interest on TLT has potential to be an important factor. As of the end of June, the count was 20.8 million, which has gone up 64 percent in three months (Chart 3). This is a potential source of squeeze should TLT catch a bid and rally past 50-day moving average.
This outcome is possible, considering that TLT’s daily momentum indicators are itching to move higher. At the same time, the 10-year yield is moving lower after facing resistance at 2.5 percent.
Hypothetically, this is all setting up well for an options trade.
As things stand now, two strategies come to mind.
First, a weekly July 24th 117/115 bull put spread nets a credit of $0.66 (117 short put for $0.95 and 115 long put for $0.29); $1.34 is at risk. An alternative is a simple cash-secured put. July 24th 116.50 puts fetch $0.73. If put, it is an effective long at $115.77 – not bad considering the oversold technical conditions in the near-term. The latter strategy probably suits the current circumstances. In the past, on two different occasions – one on May 19th and the other on June 16th – similar trades paid off.
Thanks for reading!
