
The Nasdaq 100 is making the headlines – for the wrong reasons.
Early in the year, it started to outperform its major U.S. peers. Now it is lagging – massively. June-to-date, the index is down two percent. In contrast, the Dow Industrials, S&P 500 large cap index, and the Russell 2000 small cap index are all up – 1.4 percent, 0.3 percent, and 2.4 percent, respectively.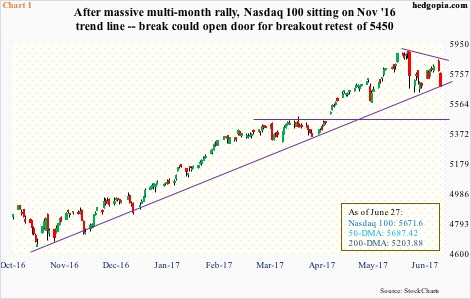
In the current sell-off, the Nasdaq 100 is also the first of the four to lose the 50-day moving average, which occurred Tuesday, and is precariously sitting on a rising trend line from last November (Chart 1).
All these four indices posted a fresh record high on June 9, and have come under pressure since. Except the drop on the Nasdaq 100 feels different. On June 9, it dropped 2.4 percent, producing a bearish engulfing candle. Twelve sessions later on the 27th, it dropped another 1.8 percent, helping forge a week-to-date bearish engulfing candle.
The recent action comes on the heels of seven straight up months. From the intraday low last November to this month’s high, the Nasdaq 100 jumped just under 27 percent! Digestion of these gains only makes sense.
The question is, is this just normal digestion or something more than that?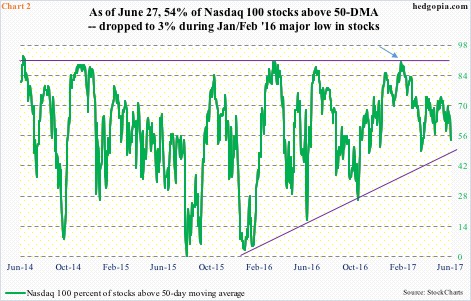
As of Wednesday, 54 percent of Nasdaq 100 stocks were above their 50-day moving average. In February this year, this hit 90 percent before heading lower (arrow in Chart 2), even as the index continued its ascent (Chart 1) – meaning the rally was increasingly led by the heavyweights. Never a healthy development in a larger scheme of things.
When the index – and U.S. stocks in general – reached a major bottom in January/February last year, only three percent of Nasdaq 100 stocks were above their respective 50-day. So in a worse-case scenario, this metric has lots of room to drop.
The Nasdaq 100 is overbought on both weekly and monthly basis.
For now, a trend line can be drawn from February last year – which will be tested around 50 percent (Chart 2). Bulls probably need to save this. As they do the 5450 level on the Nasdaq 100, which it broke out of two months ago (Chart 1).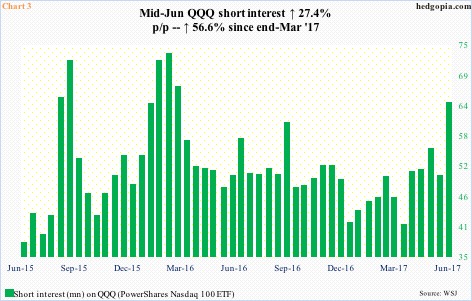
The 5450 support is also important in that by then the index would have dropped 7.6 percent from the recent peak – decent drop to test shorts’ resolve. Would they feel tempted to cover and lock in profit or stay put and deny bulls the benefit of short covering/squeeze?
Shorts have been adding. In five months through mid-June, short interest on the Nasdaq composite went up 9.9 percent. XLK (SPDR technology ETF) shorts went aggressive post-presidential election last November, and have stayed with it despite a huge rally in the ETF (both charts here).
Similarly, in the June 1-15 period, QQQ (PowerShares Nasdaq 100 ETF) short interest surged 27.4 percent to 63.8 million shares. As early as end-March this year, short interest was 40.7 million (Chart 3).
Time and again in this eight-plus-year bull market, overzealous shorts have been a big help to the bulls – be it through softening the effect of downward pressure by covering or by simply getting squeezed. Once again, they are likely to play a crucial role in if 5450 is lost or saved on the Nasdaq 100.
Thanks for reading! Please share.
