
The House pushed through a bill last Thursday aiming at getting rid of many of the Dodd-Frank reforms implemented post-Great Recession.
The bill probably does not pass the Senate, but the very idea of less/lax regulations lit a fire under financials.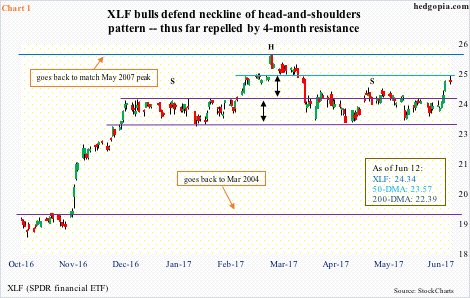
Last week, XLF (SPDR financial ETF) jumped 3.6 percent. Monday, it rallied another 0.9 percent before paring gains to close up 0.2 percent. The session produced a long-legged doji right at nearly four-month horizontal resistance (Chart 1).
This also completes a measured-move-target following last week’s range breakout (indicated by black bi-directional arrow). The ETF went sideways between 22.80 and 23.70 for six months. The low end of that range makes up the neckline of a potential head-and-shoulders formation.
That support is intact. A break also completes a potential double-top formation. In March this year, XLF retreated after hitting 25.21, within 10 cents of the all-time high 25.31 reached in May 2007.
Yes, the ETF has had a massive rally in the wake of the presidential election last November and arguably is digesting those gains, but the inability to take out the May 2007 high also points to other problems.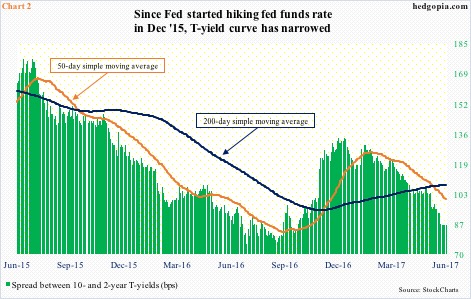
Today, the FOMC meets, and is all set to hike by 25 basis points tomorrow, to a range of 100 to 125 basis points. This will be the fourth 25-basis-point increase since December 2015. Ideally, this is good for financials.
Here is the rub.
In general, banks borrow short and lend long. The short end of the yield curve has responded to the increase in the fed funds rate by pushing up, but the long end refuses to go along. Since December 2015, 10-year yields have remained essentially unchanged at 2.21 percent, even as two-year yields have expanded by 37 basis points to 1.35 percent.
The result is a narrower yield curve (Chart 2), with the 50-day moving average in particular decidedly pointing down. This has repercussions.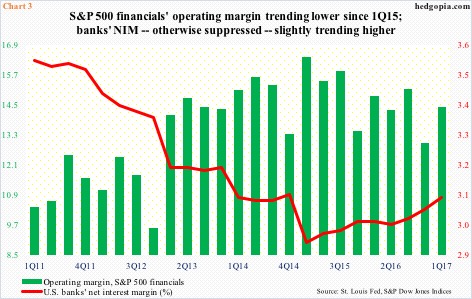
U.S. banks’ net interest margin has not gone up a whole lot. In 1Q17, it stood at 3.1 percent, up from 2.95 percent two years ago, which was the lowest since at least 1Q84.
In the meantime, operating margin for S&P 500 financials has trended lower since peaking in 1Q15.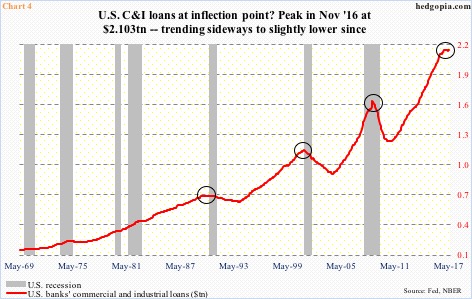
This is coming at a time when U.S. banks’ commercial and industrial loans are no longer rising.
They peaked at a seasonally adjusted annual rate of $2.103 trillion last November, and have essentially gone sideways to slightly lower. May was $2.1 trillion (Chart 4), up $2.8 billion month-over-month. This was the second straight up month, but preceded four down months in eight. The m/m contraction last August was the first since October 2010.
The point is, there is a shift in momentum. It is too soon to call, but if permanent, the next major trend is down. C&I loans were $1.18 trillion in October 2010, and obviously have had quite a ride. Incidentally, prior major peaks have coincided with recession.
This is probably one more fundamental data point on the back of investors’ minds not to want to get too aggressive near technical resistance. Hence the sell-off in XLF at/near the May 2007 high. Bulls have their work cut out to prove otherwise.
Thanks for reading! Please share.
