
- Retail sales soft in Jan – first back-to-back m/m drop since mid-12
- Consumers not quite ready to do away with savings from low gas price
- XLY, RTH break out, betting consumers will end up spending gas windfall
U.S. retail sales were soft in January. The 0.8-percent month-over-month drop came on the heels of 0.9-percent decline in December. This was the first back-to-back drop since mid-2012. Year-over-year, sales grew a respectable 3.3 percent but has been in clear deceleration particularly since November last year (Chart 1).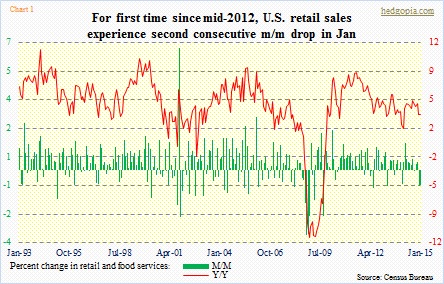
The thing is, you would not know it from looking at Chart 2. RTH, the retail ETF, notched another high yesterday. This also applies to XLY, the consumer discretionary ETF (Chart 3). In fact, both of them broke out last week. Since it broke out of $63-plus last October, XLY has gone parabolic. Early this month, there was yet another breakout. RTH acts similarly. It broke out of $61 last October, and last week saw a high-volume engulfing candle. Both show healthy price action.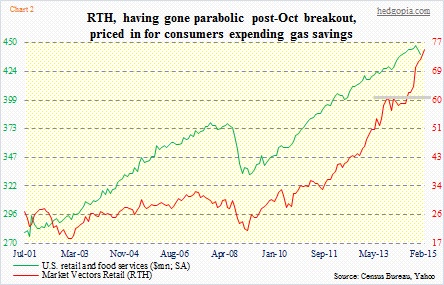
The momentum continued yesterday, despite the much-softer-than-expected retail sales report. Looking at Chart 2, directionally the red line tracks the green line well. In January, retail sales were 1.7 percent lower than the November high of $447.1bn. RTH, on the other hand, is yet to pause to catch breath. The only probable reason one can think of is this. Investors expect the green line to turn back up and catch up with the red. For that to occur, the hope is that consumers will end up spending their gas savings.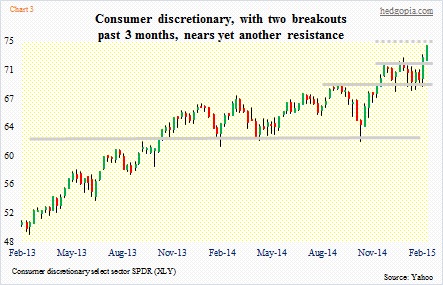
Some of the decline in January’s retail sales of course was due to gasoline sales, which at $35.3bn were lowest since October 2009. Over the past year, consumers have spent $11bn less on gasoline. In keeping with the collapse in crude since June last year, the price of regular gas has come down from $3.64/gallon to $2.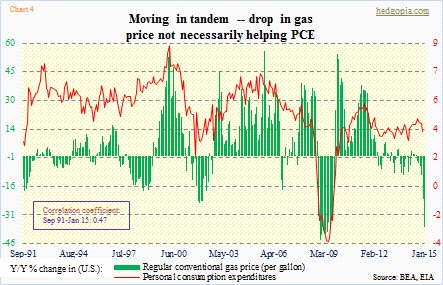
Consumers are yet to splurge all those savings on other categories. Ex-gasoline, retail sales were essentially flat in January. Chart 4 kind of explains why that is. For at least going back over a decade, change in personal consumption and gas price have moved in tandem. One would think they would move inversely to each other. U.S. households are less leveraged than in months leading up to the Great Recession – but leverage is still high historically. (Household debt as a percent of disposable personal income stood at 124 in 4Q07, vs. 96.6 in 3Q14.)
Continued frugality on the part of consumers is not what has been priced in in XLY and RTH. Gas savings need to get into other retail categories. That is what is priced in. Now, consumers have been saving for a while now. And there are some signs that they have already begun to spend some of that. Chart 5 plots three-month average of retail sales ex-gasoline. As can be seen, the y/y growth rate has been firming up since July last year.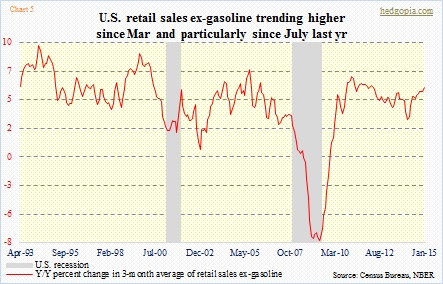
Both XLY and RTH sure act like that will not only continue but accelerate. They both act strong, but are extended. XLY, in particular, is right near resistance calculated by measuring the distance of the breakout – 72 is a must-hold. On RTH, that level is 73. If the recent breakout is genuine, buyers should be ready to step in when price pulls back.
