
- U.S. dollar suffered six-year downtrend before embarking on multi-year consolidation phase
- Recent pullback in the wake of parabolic move, amid grossly overbought technicals
- Too soon to say if breakout is reversal or continuation of prior trend
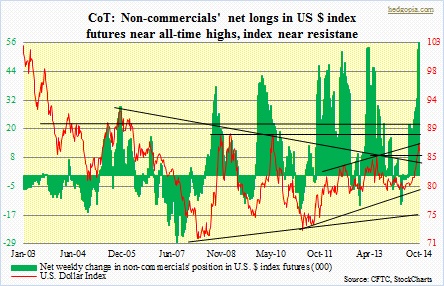 If the US dollar index closes October where it closed yesterday, this would be the first time in four months that the index would be signaling the bull-bear duel is about even. Indecision! In July, August and September, the index appreciated nearly eight percent – a humungous move in the currency world. After such a parabolic move, it is not uncommon to rest. Does not mean a reversal is in order. At the same time this does not mean there is not one in the making either. From a bull’s perspective, there are so far no signs of distribution. Which we may begin to see if bulls are unable to defend the 85 support. Until that happens, the index deserves the benefit of the doubt. It may just be a normal pullback. After all technically, it just broke out of a multi-year triangle pattern. Fundamentally, the dollar has a lot going for it as well. Economic data on this side of the Atlantic are better than in the euro zone or Japan. Perhaps more importantly, the consensus thinks the U.S. economy only strengthens from here, with a pickup in business capital spending. Rates on the short end of the curve are expected to begin to rise next year, and that has probably caused (1) traders to position accordingly and/or (2) capital that in the past was invested in higher-interest countries to come back to the U.S. Hedge funds’ dollar bullish views are reflected in the futures market.
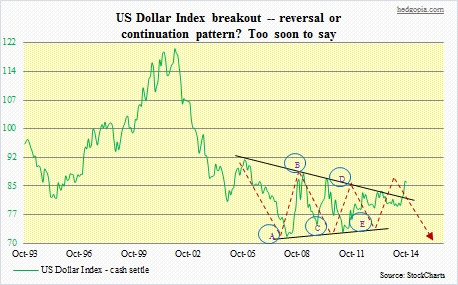 If technicals rule and assuming the recent breakout is genuine, a measured move would suggest a price north of 100 (85.76 as of Tuesday). One can only imagine what that would do to gold. Here is the thing, though. The triangle breakout can both be a reversal or continuation pattern. Prior to embarking on a long consolidation phase, the dollar had been in a downtrend. It peaked in January 2002 at 120.24, made a low of 71.41 in April 2008 before going sideways and consolidating. A break out of such consolidation is expected to occur with great force. And that has happened. As to if it is a reversal of the prior trend or just continuation, it is a wait-and-see for now. More often than not, they are the latter. In our case, the greenback just broke out, so one can argue that the trend has already been reversed. Yes, with one ‘but’. As in everything in life, there are ‘ifs’ and ‘buts’ in technical analysis. The A-B-C-D-E formation as shown in the chart can develop (it is not clean, though). Alternatively, it is common for such formation to experience a throwback, in which it pulls back before reasserting itself. We may very well be in the midst of one right now — or not. It is not even worth predicting where it is going to go. It will tell us. In due course.
