
In the aggregate, tech earnings have been a disappointment in the current earnings season. With the exception of FB (Facebook), from Apple (AAPL) to Alphabet (GOOGL) to IBM (IBM) to Netflix (NFLX), 1Q16 results have left a bad taste in investors’ mouth.
First off, as has been pointed out repeatedly on this blog, earnings expectations for 1Q16 – as well as the remaining three quarters this year – have been persistently revised lower. The bar was low for companies to hurdle.
And they are missing. Says a lot about the state of the economy – both U.S. and global – and about end-demand for technology products and services.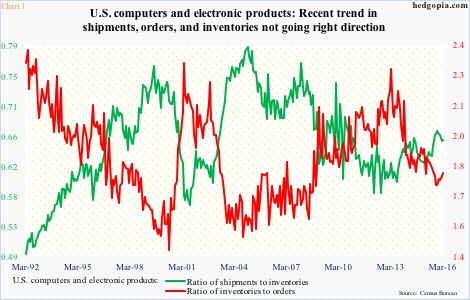
Based on data put out by the Census Bureau, orders for computers and electronic products peaked at a seasonally adjusted annual rate of $25.8 billion last November. March was $25.1 billion, down 1.6 percent year-over-year. This was the first y/y decline since December 2013. As early as December 2014, orders were growing at 14.8 percent.
In Chart 1, the ratio of inventories to orders, which had been in decline since March 2013, bottomed last November, and is rising. That was also when the ratio of shipments to inventories peaked. Recent trends in shipments, orders, and inventories are not going the right direction.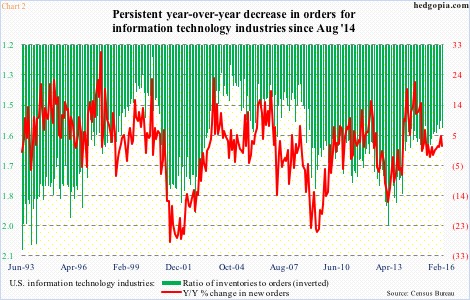
A similar trend can be detected in Chart 2. Orders for information technology industries peaked last March at a seasonally adjusted annual rate of $25.5 billion. February was $24.2 billion, for y/y growth of 1.3 percent. Growth has decelerated substantially from double-digit rates of 2014. On the positive side, the ratio of inventories to orders has been under pressure for months now; that said, it is beginning to rise again.
One persistent theme in the current U.S. recovery has been sub-par growth – much weaker than expected and than prior recoveries. This can have huge implications for capacity. Capital projects are planned months, even years, in advance. Obviously, when actual end-demand falls short of rosy forecasts, the end result is glut.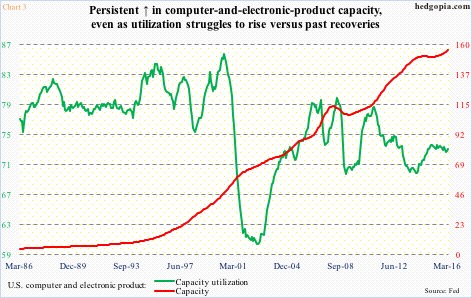
Chart 3 plots capacity with utilization in the U.S. ‘computer and electronic product’ category. March capacity was at an all-time high, up 3.2 percent y/y. The last time capacity shrank y/y was in October 2009.
Capacity utilization, on the other hand, has been going sideways to slightly down since January 2015 – from 73.7 percent back then to 73.1 percent in March. Utilization of computer and electronic product capacity has been substantially lower than in past recoveries.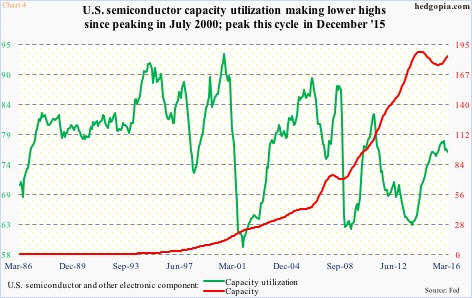
It is the same phenomenon in the ‘semiconductor and other electronic component’ category (Chart 4). Utilization peaked at 93.4 percent in July 2000, and has since persistently made lower highs. In the current cycle, it peaked last December at 77.9 percent. Capacity peaked in April 2014, but has been rising again since last August.
From a longer-term perspective, both Charts 4 and 5 are foreboding. There is simply too much capacity in the system, and demand is not rising fast enough. Not music to the ears of vendors of tech products and services.
Thanks for reading!
