
Phew!
U.S. housing starts snap back in April, rising to a seasonally adjusted annual rate of 1.135 million. This is the most since November 2007, when starts were 1.197 million. Month-over-month, they were up 20.2 percent in April. This is a volatile series, hence m/m data tends to swing a lot. February, for instance, was down 16.7 percent.
Nonetheless, the 12-month rolling total has now stayed above one million in six of the past seven months. The April snapback was badly needed considering that starts have struggled to persistently stay above the one-million mark in the current cycle.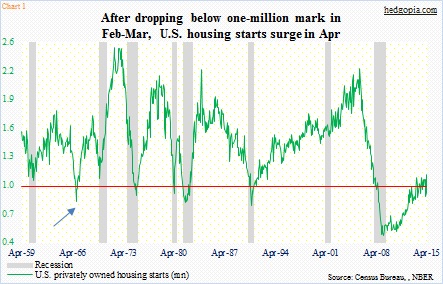
As Chart 1 shows, it is rare for starts to stay under one million in a non-recessionary period. The only other time in over five decades was back in 1966 (blue arrow in Chart 1).
The April jump is a relief. Too soon to say if it is a one-off or a new trend. Builders continue to express optimism, even though there is a wide gap between what they say and what they do (Chart 2).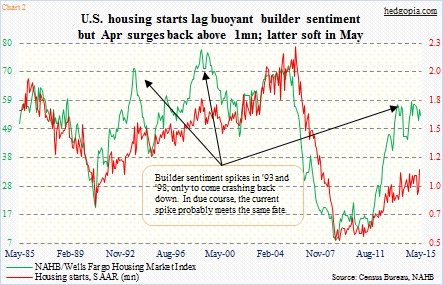
Home prices have had a very sharp recovery, and that has not helped in terms of affordability. Nor has sluggish growth in incomes. Nonetheless, recent trend in household formation can act as a tailwind if prices and incomes stop being deterrents.
Household formation peaked in October 2012 at 115.1 million and was stuck in the mud until it troughed at 114.6 million in March 2014. Then something happened. Someone flipped the switch, so to speak. By last December, households had grown by 2.2 million in those nine months. The March (2015) reading of 116.1 million is slightly under the December peak of 116.8 million, but is at a much healthier level versus a year ago.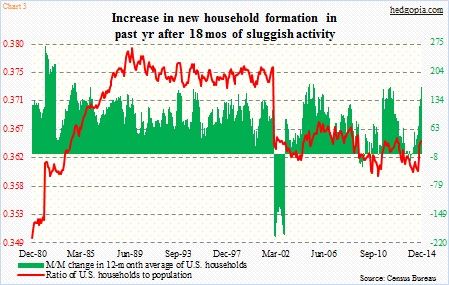
If there is any downside to this, it is that since December we have lost 700,000-plus households. As a result, the ratio of households to population has weakened to 0.362 from 0.364 in October/November last year. Nonetheless, the red line has seen a nice uptick on the right side of Chart 3.
These households can either rent or own. For the latter, the two important variables to watch are wages and home prices.
Thanks for reading!
