
U.S. equity indices are near all-time highs.
One would logically think retail investors would be all in, that foreigners are actively taking part in the rally, and that traders are making use of margin debt as never before.
None of that.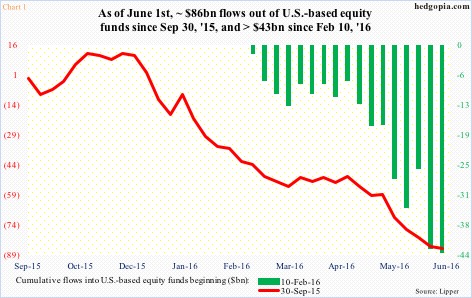
Most recently, stocks bottomed on February 11th.
Since the week ended February 10th through June 1st, north of $43 billion has left U.S.-based equity funds (Chart 1). Go back even further, all the way to late September last year, when another strong rally ensued a sell-off in August, and the trend in flows is similar. Since the week to September 30th last year, nearly $86 billion has been redeemed.
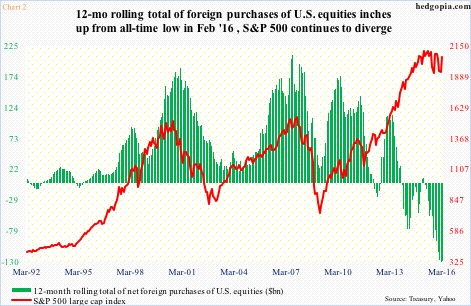
Not to be outdone, foreigners have for a while been net sellers of U.S. equities. In fact, in the 13 months to March this year, only January (this year) and July (last year) saw net purchases – $4.6 billion and $6.4 billion, respectively.
The last time the 12-month rolling average of foreign purchases of U.S. equities was positive was in February last year, with $138.9 billion in net sales this February – a record. March improved a little to net sales of $128.4 billion, but the trend remains down.
Ironically, the S&P 500 continues to diverge from the green bars in Chart 2.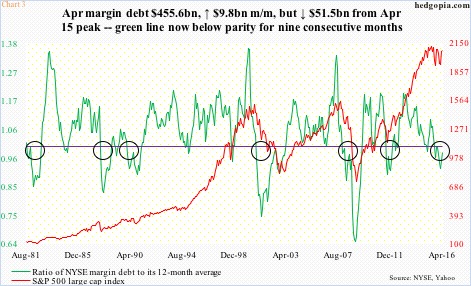
And, yes, retail this time around is not relying much on margin debt either. It did. NYSE margin debt peaked in April last year at $507.2 billion, followed by a 1.6-percent drop in the following month. The S&P 500 peaked in May last year at 2134.72.
Margin debt dropped all the way to $435.8 billion this February before rising to $445.8 billion in March and then $455.6 billion in April. Stocks bottomed in February, with the S&P 500 index surging 6.6 percent in March and 0.3 percent in April. Margin debt only rose by $10 billion each in those two months. The rather lukewarm increase in April is particularly revealing in that this came on the heels of the March surge in stocks.
There is both good and bad in this.
The S&P 500 is a stone’s throw away from the May 2015 peak, yet margin debt is nowhere near the April 2015 peak. Corporate buybacks for the most part have made up for this shortfall.
Further, if the two-month (March and April) momentum in margin debt is maintained, and, let us say, May sees another $10-billion increase, to $465 billion, the bearish signal from the green line in Chart 3 would have been nullified. The line represents a ratio of NYSE margin debt to its 12-month moving average.
As the circles in Chart 3 show, any time the green line drops below one and sustains, it has brought bad news to stocks. This time was no exception, with sell-offs in August last year and January this year. It has been below parity for nine straight months; that said, March and April have seen an uptick. So a lot depends on what May brings. The S&P 500 did rally 1.5 percent in that month.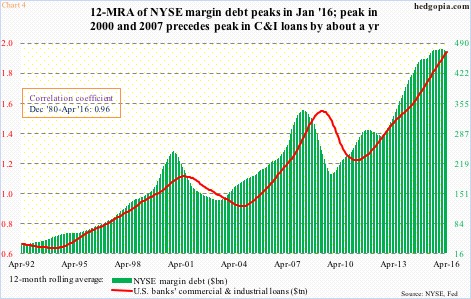
Last but not the least, a peak in margin debt – if it is a peak – can have implications for banks’ commercial & industrial loans. Using a 12-month rolling average, margin debt peaked this January at $476.7 billion and has slightly dropped since. In April, C&I loans were at a seasonally adjusted annual rate of $2.05 trillion, a new high, with the 12-month rolling average of $1.94 trillion, also a new high.
At least in 2000 and 2007, the green bars in Chart 4 led the red line by about a year. This time around, if this relationship holds, it will be a while before the latter peaks.
Thanks for reading!
