
Looking around, there is no lack of things for investors to worry about. Although that is not the impression one gets looking at how gold is trading.
After an incessant rally, Chinese stocks are in the midst of a sharp sell-off. One would think this would help the yellow metal by at least attracting some of that money – kind of a safe-haven trade. Then there is Greece. Since elections in January and the subsequent uncertainty it unleashed in the eurozone, gold has lost nearly 10 percent. It has also not responded to quantitative easing in both Japan and the eurozone.
As a matter of fact, gold stopped positively reacting to QE much earlier.
In the U.S., QE2 ended in June 2011. Gold peaked in September that year – at $1,923.70 an ounce. The corresponding high on GLD, the SPDR Gold ETF, was $185.85. Come September 2012, the Fed launched QE3, which lasted two-plus years. Gold never got going. Turns out the inability to rally on what turned out to be an aggressive iteration of QE was a huge telltale sign.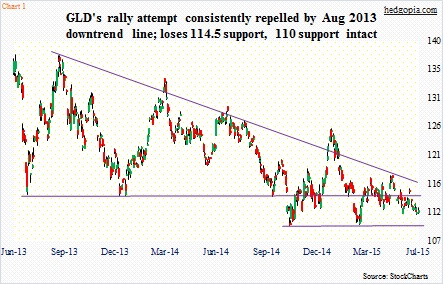
For nearly two years now, the metal’s rally attempt has been repelled by the August 2013 down trend line (Chart 1). Throw in higher interest rates, which have also hurt interest rate-sensitive sectors such as utilities and REITs, gold bugs continue to be down in the dumps. Not to mention the fact that between last July and March this year the dollar enjoyed a rip-roaring, 26-percent rally.
Bulls are giving up – at least in some quarters.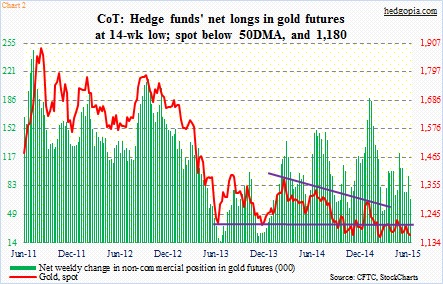
By January 27, non-commercials were net long 189,000 contracts in gold futures. Spot gold traded at $1,292.1 then. One week before that, the metal’s rally attempt once again got scuttled at the above-mentioned trendline. These traders began to cut back on their holdings. Off that January high, net longs are now down 64 percent (Chart 2).
This probably explains why a sharp drop in GLD’s short interest has not helped the ETF as it normally would/should. At the end of May, short interest stood at 18.4 million, and declined 27 percent in the next two weeks, to 13.4 million (Chart 3). All that short-covering pretty much went in vain. GLD went from $114.1 to $113.73 during the period. By then, it had already broken important support. For two-plus years until October 2014, the ETF consistently found support at $114.50. Once that gave way, it dropped to $109.67 intra-day in November. That low was tested again in March – successfully.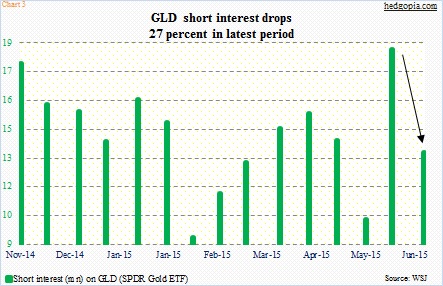
If the ETF continues to trade within $109.50 and $114.50, there are some options strategies that can be deployed to benefit from sideways action.
Here is a hypothetical GLD July 17th 108.50/109.50/114.50/115.50 iron condor:
Long 115.50 call for $0.17
Short 114.50 call for $0.29
Short 109.50 put for $0.26
Long 108.50 put for $0.15
This nets a credit of $0.23, even as $0.77 is at risk, should the ETF break out of the wings. Mid-May, GLD did rise all the way to $117.88 before finding resistance at that trendline (Chart 1). An iron condor is also a neutral strategy. Yes, there are plenty of reasons why GLD should have rallied but it has not, nonetheless near-term can be different. It is oversold on a daily chart and is near the lower Bollinger Band. At least in the near-term, the path of least resistance is probably up. So rather than an iron condor, a cash-secured put better suits the current circumstances.
Weekly July 17th 111 puts fetch $0.60. If put, it is an effective long at $110.40. Otherwise, premium is kept.
Thanks for reading!
