
Of late, equity bulls have pulled in their horns. Just a tad. Will they be rewarded for their steadfast bullishness in the near-term?
Investors Intelligence’s survey of bulls this week registered at 44.8 percent. This was the sixth sub-50 reading in the last nine weeks. Concurrently, the American Association of Individual Investor survey showed bulls at 27.9 percent – the ninth sub-30 reading in the last 10 weeks. And last but not the least, National Association of Active Investment Managers members’ average exposure to U.S. stock markets stood at 55 percent this week.
Staying with Investors Intelligence, bulls’ ranks have gradually weakened from 57.4 percent at the end of April; bears’ were 13.9 percent then. This week, bulls fell 4.7 percentage points week-over-week to 44.8 percent, even as bears’ inched up to 15.6, for a ratio of 2.9 percent. The last time bears were north of 20 percent was back in April last year. The bulls-to-bears ratio can be an effective tool to measure complacency – or a lack thereof.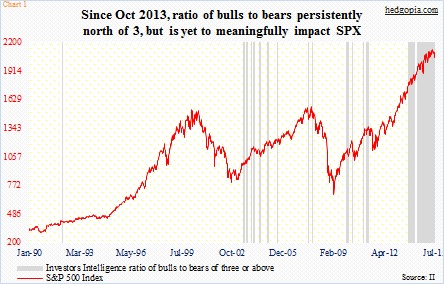
In Chart 1, the S&P 500 Index is plotted against when the bulls-to-bears ratio read three or above. Several times in the past, this has been a time to get cautious on equities. It is a useful tool, but not perfect. Nothing is. Back in 2000, the ratio never rose that high. Throughout 1999 and until stocks peaked in 2000, bears were consistently in the 20s and 30s, and that cautiousness suppressed the ratio.
The past couple of years have been the exact opposite. Since October 30, 2013, in 70 out of 89 weeks, the ratio has persistently stayed north of three or above, with 15 of them at four or above. As can be seen on the right side of Chart 1, this is a very long period of sustained complacency, without a meaningful pullback. But why is it not getting unwound?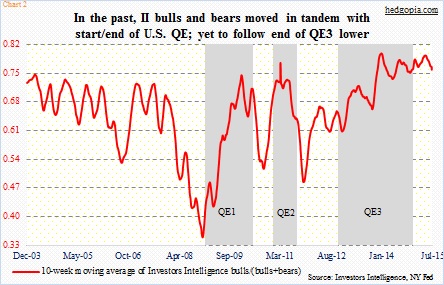
The answer probably lies in Chart 2. In it, the grey bars represent the three iterations of QE in the U.S., while the red line is a 10-week moving average of Investors Intelligence bulls/(bulls+bears). The red line bottomed ahead of both QE1/2, peaking before QE’s end. Come QE3, the phenomenon repeats itself, except for one thing. Unlike QE1/2, the red line is yet to come under sustained pressure.
Yes, bulls’ count has gone down in the past few weeks, but it is nothing major. Their ranks are not thinning drastically. During the October 2014 equity sell-off, Investor Intelligence bulls contracted to 35.3 percent, even as bears rose to 18.2 percent. The S&P 500 was a hair’s breadth away from losing 10 percent back then.
Now, bulls are holding their ground. From intra-day high to low, the S&P 500 has shed 4.3 percent. Several indices have suffered technical damage. Greece and China continue to grab the headlines. There is too much uncertainty.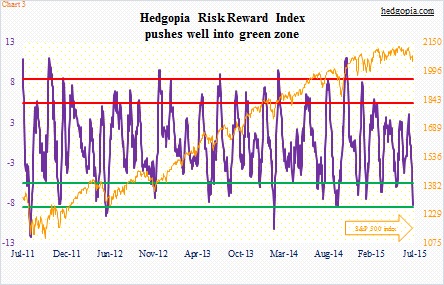
Amidst all this, bulls have been given an opportunity to step up to the plate. Near-term, conditions are oversold. The Hedgopia Risk Reward Index just entered the green zone (Chart 3). In the right circumstances, conditions are in place for the pendulum to swing the other way.
If bulls are unable to cash in on this, the red line in Chart 2 can only push lower.
Thanks for reading!
