
- U.S. personal incomes grow in April, but consumers stash away cash
- In recent months/quarters, inventories have been growing faster than orders
- ISM Manufacturing shows small improvement in order-inventory mismatch in May
The importance of U.S. consumers cannot be stressed enough – both from the perspective of spending and inventory.
In 1Q15, the personal consumption expenditures component contributed 1.23 percent to real GDP, although it was the lowest contribution in the last four quarters. GDP contracted 0.7 percent in the quarter. Economists have tuned out the 1Q shrinkage saying it is one-off, hoping things will pick back up beginning 2Q.
We got the personal-spending numbers for April yesterday, and they were not very encouraging. Incomes rose 0.4 percent month-over-month to a seasonally adjusted annual rate of $15.2 trillion, but spending was essentially flat at $12.2 trillion. The savings rate rose to 5.6 percent from 5.2 percent.
Consumers are holding on to their wallets, at least going by the latest PCE data. This can only help worsen the level of inventories which are already accumulating.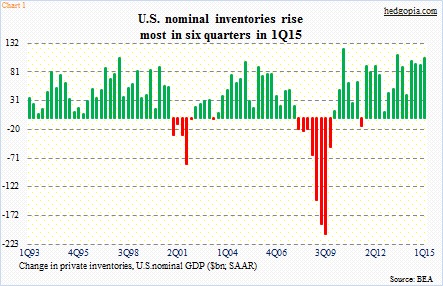
In 1Q15, nominal inventories (in the GDP report) rose $105.8 billion – the most since 3Q13 (Chart 1). Final sales to domestic purchasers (real GDP minus exports plus imports minus inventories) did rise 0.8 percent in the quarter, but you cannot just ignore these rising inventories. They are sitting somewhere – in factories, at wholesalers and retailers, and on shelves. Buildup now will borrow from production tomorrow.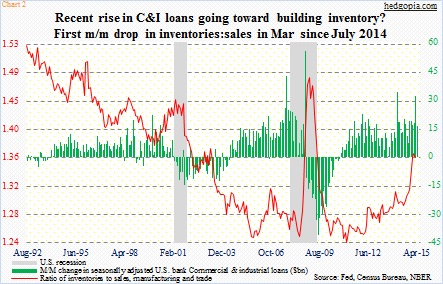
Chart 2 does a good job of illustrating the ongoing inventory buildup. The red line is as of March, so does not give us the latest picture. Nonetheless, notice the spike in the red line. March was the first time since last July that the inventory-to-sales ratio dropped month-over-month. The rise in the ratio has accompanied an increase in recent months in U.S. banks’ commercial and industrial loans. These loans have grown by north of $200bn in the 12 months through April.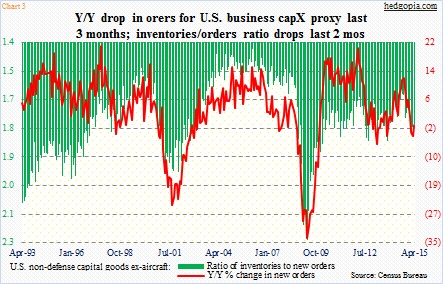
The red line in Chart 2 also jibes with the ratio of inventories to orders for non-defense capital goods ex-aircraft in Chart 3. The series is treated as a proxy for business capital expenditures. It is the same picture as far as inventories go, with a gradual but persistent rise over the past several months. April was an all-time high at $121.7 billion. The good thing is, orders, which peaked last September, have risen the past couple of months. This has helped the ratio turn lower from 1.8 in February to 1.76 in April. Looking at that big lump of green bars on the right side of the chart, orders need to begin to come in a lot better before these inventories are taken care of.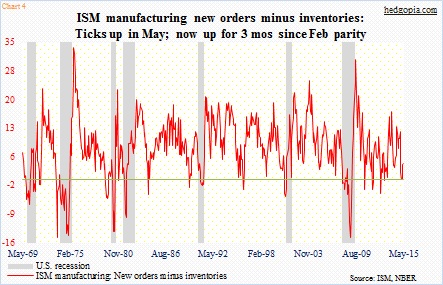
Some signs of hope came out of the ISM manufacturing report yesterday. Order activity improved in May, rising 2.3 points to 55.8. The orders index was as high as 63 last October, so it has seen quite a bit of deceleration. The good thing is, it has increased the past couple of months. The red line in Chart 4 – orders minus inventories – came close but did not go negative in February. A sustained drop below the parity line has more often than not been accompanied by recession in the past.
It is an issue worth a close watch. Inventories have been built in expectation of spendthrift consumers, and the latter has not come through.
Thanks for reading!
