
Growth in U.S. corporate profits with inventory valuation and capital consumption adjustments dipped into the negative territory in 3Q15 – both quarter-over-quarter and year-over-year. At a seasonally adjusted annual rate of $2.06 trillion, they compared with $2.08 trillion in 2Q15 and $2.16 trillion in 3Q14.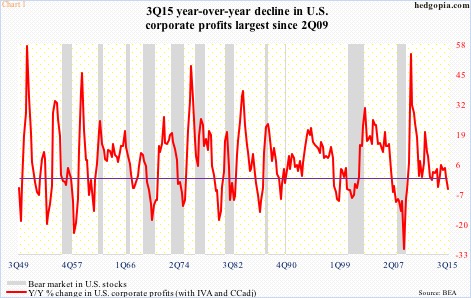
Post-Great Recession, corporate profits have dropped y/y three times. The 4.7-percent drop in 3Q15 is the largest since 2Q09, when profits fell 4.9 percent (Chart 1).
This is also the first time since 2008 that profits are on course to dropping in 2015 – be it operating earnings of S&P 500 companies or corporate profits measured by the BEA’s national income and product accounts.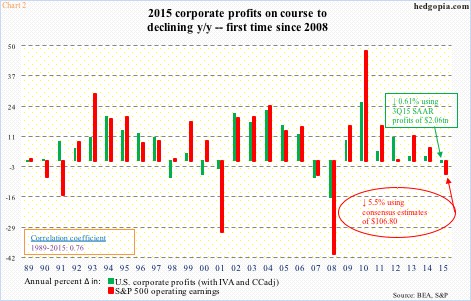
In Chart 2, for 2015, consensus estimates of $106.80 for S&P 500 companies have been used, while for corporate profits 3Q15 numbers have been used. It is possible when it is all said and done, 4Q15 will look a whole lot different from 3Q15, but the trend is in definite deceleration.
NIPA’s corporate profits have declined 4.7 percent since the 3Q14 peak. Similarly, the four-quarter rolling total of operating earnings of S&P 500 companies peaked in that same quarter at $114.51. Four quarters later, in 3Q15, they were $104.15.
In Chart 3, for 3Q15, $25.44 (as of November 12th) has been used. The quarter produced the largest y/y drop in the past four quarters. Operating earnings have dropped the past four quarters – first such occurrence since 2007-2009.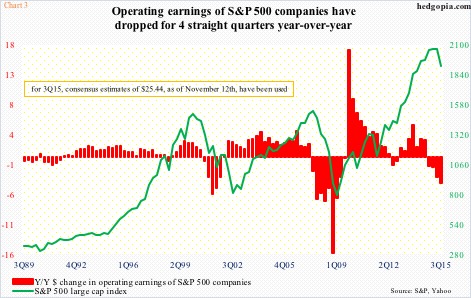
Chart 3 also shows a close relationship between earnings trend and the S&P 500 index. The green line seems to be trending lower in keeping with earnings deceleration. But the chart uses quarter-end price (1920.03). If we use yesterday’s price for the S&P 500, the green line will have completely diverged from the red bars.
Hence the question, what exactly is the message coming out of the S&P 500?
If stocks are telling us that the economy is all set to accelerate next year, that oil stabilizes here and that the dollar begins to weaken, then a case can be made that earnings can improve next year.
Else, the green line in Chart 3 will have some catching up to do.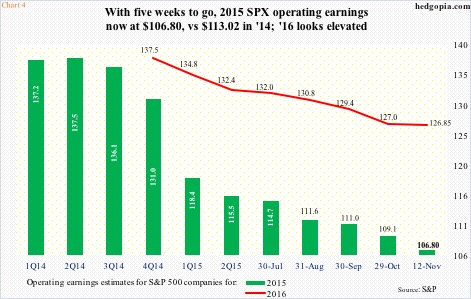
This is particularly so considering 2016 consensus operating earnings estimates for S&P 500 companies look elevated. Estimates have come down from $137.50 at the end of last year to $126.85 (as of November 12th), but they are expected to grow nearly 19 percent over 2015.
For reference, at the end of the second quarter last year, 2015 estimates were $137.50 – expected to grow north of 21 percent over 2014’s $113.02. Once it was realized that they would not be met, out came the knives. Estimates have been chopped down by more than 22 percent.
That is the risk for next year. Lots of things have to go right for 2016 estimates to be met. The green line in Chart 3 has a lot riding on the red line in Chart 4.
Thanks for reading!
