
Much ado about nothing! Really.
A lot happened in the second half of June. The 1.3-percent rally in the S&P 500 large cap index between June 15th and 30th belies the crazy roller-coaster ride those two weeks went through.
First, it was the post-Brexit, two-session 5.3-percent drop ended June 27th. This was then immediately followed by a three-session, 4.9-percent jump ended June 30th.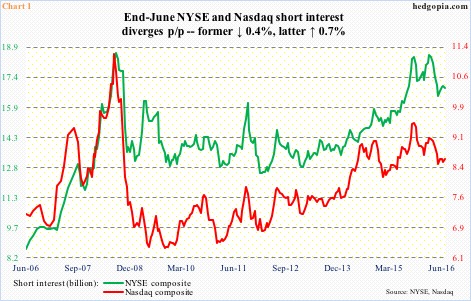
If the post-Brexit drop may have encouraged shorts to add, the subsequent sharp jump may have given them enough reason to cover.
It seems this is exactly how things evolved.
On an index level, there was not much change in short interest in the afore-mentioned period. On the NYSE composite, it fell 0.4 percent period-over-period to 16.85 billion shares, and rose 0.7 percent on the Nasdaq composite to 8.56 billion. In the aggregate, short interest remains elevated on both (Chart 1).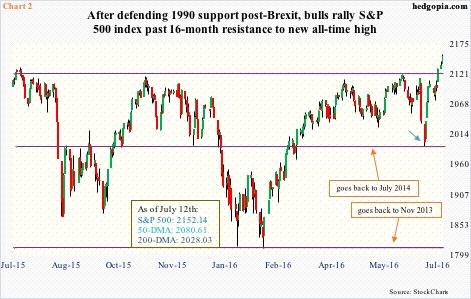
On June 27th, in the midst of that post-Brexit, two-day sell-off, the S&P 500 index found support at 1990 (arrow in Chart 2). Then it rallied hard – up nearly five percent in the next three sessions. There was much talk of short squeeze being primarily behind that jump. Either that was not the case, or shorts who aggressively added during the two-day sell-off were forced to quickly cover, in the end canceling each other out.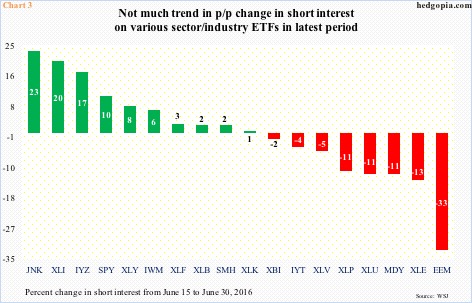
A look at short interest on a mishmash of ETFs gives the same impression. On the one hand, JNK, the SPDR Barclays high-yield bond ETF, saw short interest rise 23 percent to a five-month high, on the other EEM, the iShares MSCI emerging markets ETF, saw it collapse 33 percent to a four-period low (Chart 3). There is not much change in the way of trend one way or the other.
That said, things may be evolving a little differently in the current period.
Since June 30th through Tuesday, the S&P 500 rallied another 2.5 percent. More importantly, shorts who were holding out probably have a reason to rethink now. The index has broken out of 16-month consolidation to an all-time high. If – a big if – this is a genuine breakout, in due course the index has a shot at 2400.
So why stay short? Using this logic, some level of short squeeze may be taking place. This is borne out by the fact that price has broken out but volume remains weak. There is no institutional footprint in post-breakout action in volume.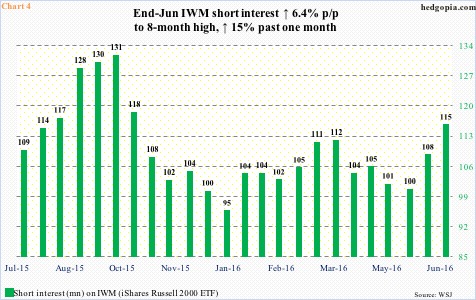
And, as pointed out earlier, short interest remains elevated on an index level (Chart 1). There is plenty of potential fuel on that basis. Not to mention important ETFs such as IWM, the iShares Russell 2000 ETF. In the recently concluded period, IWM’s short interest rose 6.4 percent p/p to 115.1 million shares. This is an eight-month high.
The only solace for IWM shorts is that, unlike the S&P 500, the Russell 2000 small cap index has not broken out to a new high, but closed Tuesday right underneath two-plus-year resistance. A genuine breakout will probably leave these shorts with no option but to cover. Short interest has gone up 15 percent in just the past month.
Thanks for reading!
