
Stocks are rallying. In fact, off the intra-day low last week, the S&P 500 index (1906.9) is already up 5.2 percent.
Last Wednesday’s hammer reversal on the index looks similar to the ones on October 15, 2014 and August 24, 2015 (Chart 1).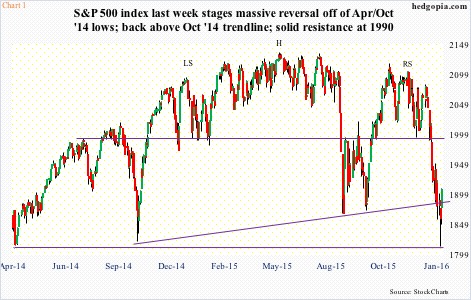
At least near-term, there is room for continuation of the current momentum. Grossly oversold indicators need to unwind.
On the NYSE composite last Wednesday, there were 1,395 new 52-week lows (only three new highs), versus 1,335 (7) on August 24th (2015), and 594 (19) on October 15th (2014). Similarly, on the Nasdaq composite, they were respectively 906 (5), 772 (12), and 346 (52).
Near the lows last week, less than nine percent of Nasdaq stocks and less than 11 percent of NYSE stocks were above their respective 50-day moving averages. These are very low readings.
Interestingly, for the first time in 13 weeks, non-commercials last week went net long VIX futures (circle in Chart 2). The last time they shifted their bias from net short to net long was on August 25th (2015). The S&P 500 bottomed on the 24th.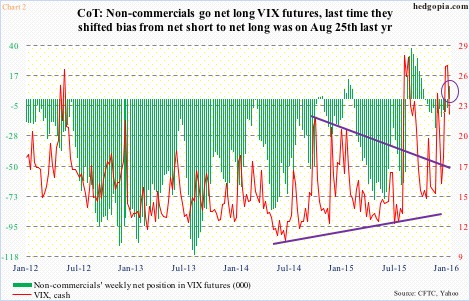
Several times in the past, non-commercials going net long VIX futures has coincided with a peak in the spot, which by default means a trough in stocks. Chart 2 shows three such occasions: October 2014, January 2015, and August 2015.
Should things unfold in a similar manner, spot VIX (22.34), which just fell out of a three-week rising channel, can continue to come under pressure. Nearest support is at 20-ish.
With a good likelihood that the current momentum remains intact on the S&P 500, it has a shot at 1990, an important line of support/resistance going back to June 2014. This is also a spot where shorts can get active again – hence kind of a line in the sand between bulls and bears.
Along the same lines, on the Nasdaq 100 (4259.77), the nearest resistance lies at 4350, followed by 4480, on the S&P mid-cap 400 (1287.77) at 1350, and on the Russell 2000 (1020.66) at 1080.
Cogent arguments can be made both ways as to which way U.S. stocks might be headed near-term. On the bullish side, it is an easy sell. Stocks are oversold, and it does not take much to unwind these conditions.
However, it is equally plausible stocks rally to the afore-mentioned resistance and then come under renewed pressure.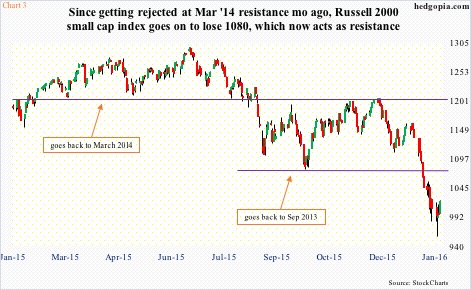
Speaking of the 1080 resistance on the Russell 2000, Chart 3 depicts the breakdown it has suffered. Except for a few months last year, the index has essentially been going sideways since March 2014.
A break of the March 2014 trend line in August last year and a failed retest later in November/December resulted in a waterfall drop. From high to low, the Russell 2000 lost 26 percent. It is a sector heavily exposed to the domestic economy, and money moving out speaks volumes about the state of the U.S. economy.
As do the transports.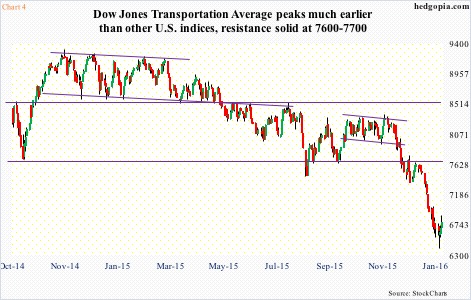
The Dow Jones Transportation Average peaked in November 2014 (Chart 4). Incidentally, crude oil began to come apart after peaking in June 2014. If the collapse in crude was merely supply-related, transports sh/would have rallied as they are heavy users of oil. Rather, they have collapsed as well. From high to low, the index fell just north of 27 percent. The problem is demand-related.
Against this backdrop, foreigners have done a great job of staying out of U.S. stocks. In August through November last year, they sold $66 billion in equities. The last time the 12-month running total was positive was back in October 2013, with November last year minus $107 billion – the highest monthly total ever.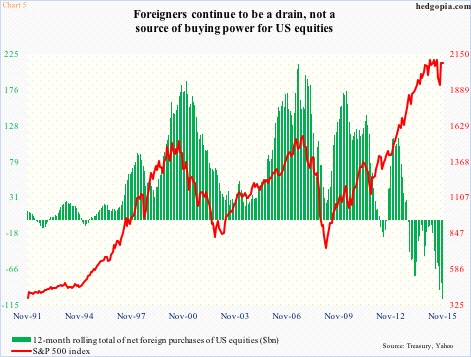
In Chart 5, the green bars and the red line have decoupled for nearly three years now. The S&P 500 is as of November last year, hence uses monthly close. Using Friday’s close, the red line drops by nearly 180 points. That said, if the variables establish the historical correlation, the red line has a lot to fall still… unless of course foreigners begin to come back in.
As things stand, the issue is the same as relates to domestic flows. Chart 6 uses flows into U.S.-based equity funds. The green line is the weekly total. The red bars represent the cumulative total beginning September 30th. That date is a good reference point in that on September 29th the S&P 500 successfully tested the August 2015 low before rallying 13 percent in five weeks.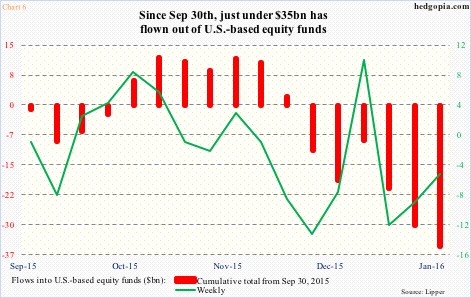
Cumulatively since September 30th through last Wednesday, these equity funds have lost just under $35 billion. This year alone, they have lost just north of $26 billion – a trend that has not helped stocks, and needs to reverse to sustain the current momentum.
As stated earlier, there is plenty of room for unwinding of oversold conditions on major U.S. indices. Post-earnings, corporate buybacks likely pick up steam. But ultimately, flows need to cooperate.
A lack thereof will only bolster the bearish signals coming from transports and small-caps, among others. In this scenario, the 1820 level on the S&P 500 gets tested again (Chart 1), and bulls will be lucky to save it. The ultimate risk to the S&P 500? A retest of March 2000/October 2007 highs around 1600.
Thanks for reading!
