
It can potentially be a momentous day. December 16th, that is. That is when the Fed would be completing its two-day FOMC meeting – this year’s last – and decide whether or not to raise interest rates.
The last time rates were raised was nine-plus years ago. On June 29, 2006, the fed funds rate was pushed up by 25 basis points to 5.25 percent, and stayed there until September 18, 2007 when it was eased by 50 basis points.
The rest is history. By December 2008, rates were near zero, and have stayed there since.
So a decision to hike – be it this month or later – will be an important step away from the prevailing ultra-loose monetary policy.
Fed funds futures are betting that a hike is imminent in two weeks’ time, putting the odds at 75 percent. The short end of the Treasury yield curve is equally adamant about it. Two-year yields, which tend to be the most sensitive to Fed policy, yield 0.94 percent – the highest since May 2010 – up from 0.57 percent as early as October 14th.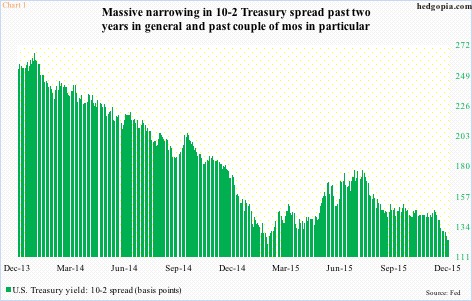
That said, the long end of the curve is not in complete agreement with this scenario. The spread between 10- and two-year yields is narrower than just a couple of months ago, let alone a couple of years – 124 basis points now versus 142 bps on October 14th, for instance (Chart 1).
Either the 10-year does not think a hike is coming in two weeks’ time or that it would be a policy error.
Amidst all this, Tuesday brought us this.
At 48.6, November’s ISM manufacturing index was an out-and-out disappointment – first sub-50 reading in three years. New orders were 48.9 – first drop below 50 since May 2013. The inventories component, at 43 in November, has been under 50 for five straight months.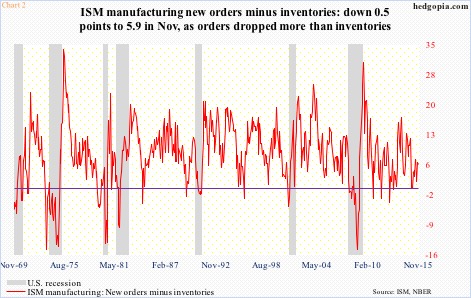
In fact, if not for inventories, the red line in Chart 2 would probably be a lot lower. It has been weakening since July last year. Orders peaked at 63.9 last August, and inventories at 53 in June this year. The spread between the two has risen from unity in February this year, but remains weak.
To be clear, a drop below 50 is not a death knell in and of itself. Yes, it means contraction, but it can always snap right back, as it did three years ago. In November 2012, the manufacturing index dipped below 50, to 49.5 – first sub-50 reading since July 2009 – but in the very next month got right back above 50, and stayed there until last month.
So a natural question is if last month’s reading is a blip like the one in November 2012 (blue arrow in Chart 3) or a prelude to something serious, like in January 2007 (orange arrow), which ultimately ended up leading to 2008.
It is a tough call.
Inventory remains high, with the inventories-to-sales ratio in U.S. manufacturing and trade at 1.377 in September – the highest since June 2009 (1.385). In October, non-defense capital goods ex-aircraft – proxy for business capital expenditures – rose year-over-year for the first time in nine months. Even the erstwhile reliable jobs momentum is softer. October saw an addition of 271,000 non-farm jobs, reversing sub-200,000 jobs in August and September, but the 2015 average of 206,000 is much weaker than the 2014 average of 260,000.
Things are vulnerable.
The long end of the yield curve seems to be suggesting exactly that.
Amidst all this, we have a potential Fed move in two weeks’ time. A hike would be momentous for various reasons, not the least of which is the fact that manufacturing just shifted into contraction mode.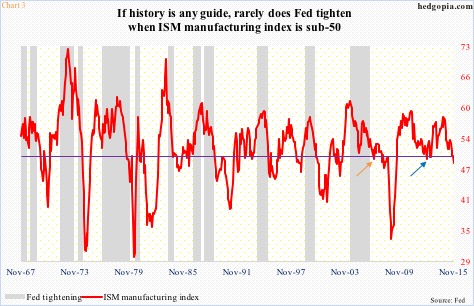
In fact, going back nearly five decades, only once has the Fed tightened when the ISM manufacturing index was sub-50. That was August 1980. The red line in Chart 3 read 45.5 back then; the fed funds rate went from 9.5 percent to 10 percent. Paul Volcker, then-Fed chair, was doing his best to stamp on runaway inflation. And the tightening campaign had begun much earlier – in December 1976, with fed funds at 4.75 percent in late November.
With this as a background, the Fed would be making history of some sorts if it went ahead and tightened this month.
Yesterday in a speech, Janet Yellen, Fed chair, expressed confidence in the economy.
That said, at least in the period covered by Chart 3, rates were never this low when the Fed began to tighten. It is possible it is simply trying to fill its monetary quiver with arrows – preparing for the next downturn – or just plain convinced that the economy is strong enough to handle a hike or two.
Time will tell.
When it is all said and done, the 10-year may just have the last laugh.
Thanks for reading!
