
Financials are once again beginning to perk up, with XLF, the SPDR financial ETF, closing last Friday right underneath near-term resistance.
The ETF has been sideways for nearly a month. This followed a massive breakout post-election last year.
Resistance at just under $20 has been in place since December 2014. In fact, a horizontal line pertaining to that price level can be extended as far back as March 2004 (Chart 1). Underneath, $17 has provided support for years now.
So when last November XLF convincingly broke out of this multi-year range, technicians were eyeing $23, or thereabouts. The measured-move target got fulfilled in no time.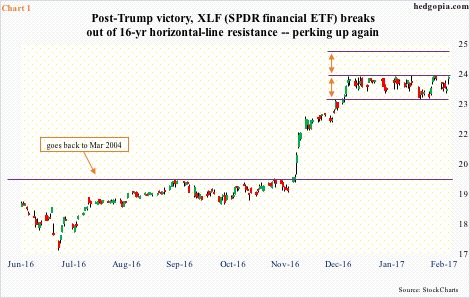
The ETF remains overbought – on nearly all timeframes. Momentum is yet to break, though.
As it began to go sideways in early December last year, it was 11 percent above its 50-day moving average. The post-election surge simply was too soon, too fast. Having gone sideways for a month now, the average has caught up. In fact, twice last week, bids showed up near that average, which is still rising, but barely.
Interestingly, since that December 8 high, XLF has been trading within a one-point box. Should a breakout occur, we could be looking at just under $25. Its all-time high was $25.40 in May 2007.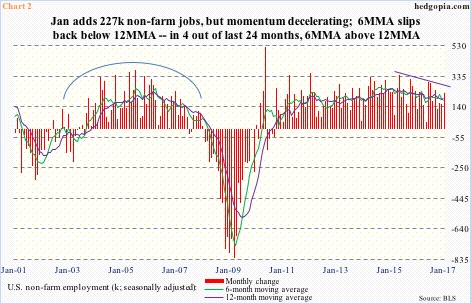
But why are financials rallying?
Last Friday, in the wake of January’s better-than-consensus payroll report, bulls defended XLF’s 10-day moving average, which is now slightly rising. The ETF jumped two percent in that session. But the report also informed us that wages for private-sector employees decelerated to growth of 2.5 percent year-over-year from 2.8 percent in December. The last time average hourly earnings grew with a three handle was in April 2009.
Even as relates to employment, unless January represents a trend change – hard to swallow given the recovery is nearly eight years old – there is deceleration. Last year, the U.S. economy averaged a monthly addition of 187,000 non-farm jobs, versus 226,000 in 2015 and 250,000 in 2014.
In Chart 2, the six-month moving average of monthly change in payroll once again dipped back below the 12-month. In the past couple of years, there have only been four months in which the 6-month crossed over – a clear sign of decelerating momentum.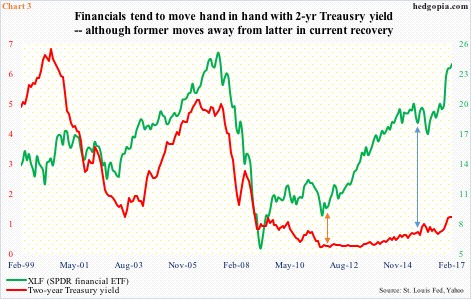
Financials have also been moving hand in hand with two-year Treasury yields. The latter tend to be sensitive to the Fed’s monetary policy – or expectations thereof.
Most recently, two-year yields bottomed at 0.56 percent last July, then rising to 1.29 percent by December 15 last year. (The FOMC in the December 13-14 meeting raised the fed funds rate by 25 basis points to a range of 0.5 percent to 0.75 percent.)
Chart 3 does injustice to this correlation in that not much is seen in the right half, as the green line persistently moved away from the red. This, however, is precisely the point the chart seeks to highlight.
In June 2009, the two-year yielded 1.18 percent, versus 1.21 percent last Friday – essentially flat. XLF during the period went up nearly 180 percent. That said, for the last several years, financials have closely followed the two-year.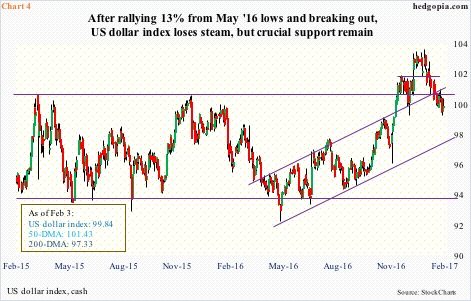
With all this as a background, here is what to watch, should XLF indeed break out of one-month congestion.
During his presidential campaign, President Trump was critical of the Fed’s easy monetary policy. In the FOMC meeting last week, the Fed left rates unchanged. When it hiked in December, the dot plot suggested there might be three hikes this year. Since then, there has been visible improvement in U.S. economic data. Yet, the Fed did not even signal that March was in play.
Here is possibly why.
The U.S. dollar index rallied nearly 26 percent in nine months through March 2015, followed by range-bound action (Chart 4). It then rallied 13 percent from the lows of last May through the high early this year. The Trump administration is not happy about this. Mr. Trump himself as well as Treasury Secretary-nominee Steven Mnuchin have voiced their concerns.
Should the Fed indeed go ahead and hike three times this year, the dollar index likely gets another tailwind. This in turn is bound to hurt exports – and by default the economy – reason why the Trump administration wants a lower dollar to begin with.
Having rallied as much as they have, financials are probably not ready for either scenario – Fed that continues to be in wait-and-see mode or weak economic activity due to a strong dollar.
If XLF breaks out, saving it would be the next challenge.
Thanks for reading!
