
Despite the rout in stocks that August and September experienced, the fear-of-missing-out (FOMO) is alive and well.
From low to high, the S&P 500 index rallied eight plus percent between August 24 and September 17, followed by a seven-plus percent sell-off in the next eight sessions. The rally that followed tacked on six-plus percent in merely five sessions! A mecca for traders. Some level of short-covering probably played a role in the latest rally. As probably did buying from those that are afraid of missing out.
Seasonally, it is coming up on that time of year when stocks tend to do well. We are seeing early signs of market participants positioning for that. If they are right, there are tons of unwinding left to do in metrics like Charts 1 and 2.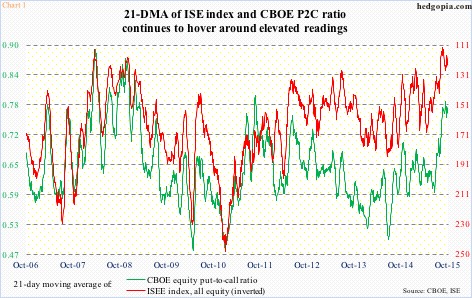
Chart 1 tallies the 21-day moving average for the CBOE equity put-to-call ratio and the ISEE index (all equity). The latter is inverted as it is a call-to-put ratio. The concept is simple. The higher the green line for instance, the higher the odds of a subsequent move to the other direction. Simple mean reversion at work. So from a contrarian perspective, the multi-year high in the green line should bode well for stocks. If it follows the traditional pattern, that is. So far, both lines are trying hard to continue to head down, but struggling.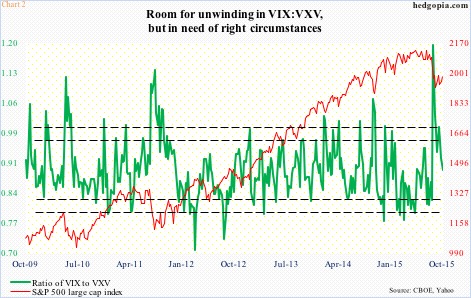
A similar struggle is portrayed in Chart 2. The green line is a ratio between VIX, which measures one-month volatility on the S&P 500, and VXV, which does the same but goes out three months. During times of risk-off, demand for VIX exceeds that of VXV. Notice the spike on the right side of the chart. That was on August 24, when the ratio closed the session at 1.03, but rose as high as 1.33 intra-day, before stocks reversed. The ratio is currently dropping.
VIX (19.40) has been more than cut in half from the August 24th intra-day spike, having dropped below 20 for the first time in 30 sessions on Monday, and needs to continue to head lower if stocks are to continue to attract bids. For all that, it is approaching oversold conditions on a daily basis.
This will have implications for whether or not the FOMO crowd has it right or is just plain too early.
So far, as far as major U.S. indices are concerned the rally in stocks that began on September 30 has stopped right where it was supposed to.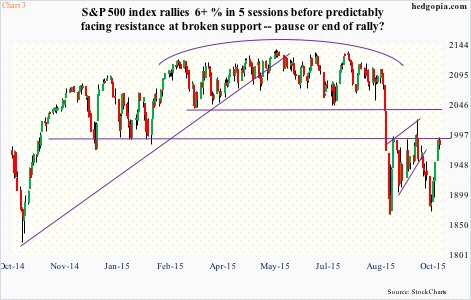
During the August-September sell-off, support levels got broken left and right, creating tons of overhead resistance in the process. On the S&P 500 (1979.92), the nearest resistance – and an important one as it has not been exceeded since late August – lies at 1990ish, some 50 points before the big one at 2040ish. After a 3.3-percent two-day rally, the index closed Monday right underneath 1990 (Chart 3). Come Tuesday, sellers showed up, though nothing serious yet. The 50-day moving average (1998.52), is still falling. The corresponding resistance on SPY (197.81), the SPDR S&P 500 ETF, lies at 198-199, with the 50-DMA at 199.27.
The S&P 500 is not alone in this behavior.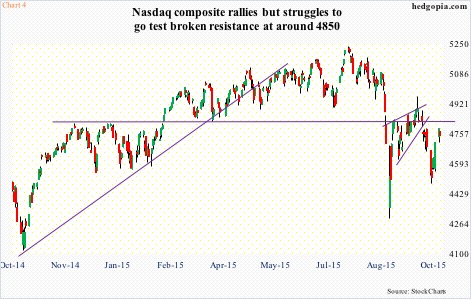
On the Nasdaq composite, 4850 has been an important price point going back to November last year. The index (4748.36) first broke out of it in February, and held above, until the vicious August sell-off. Post-August 24th low, it went on to retake that level, only to lose it again. This time around, it is struggling to even get near that resistance. Sellers are showing up earlier (Chart 4). Bio-techs once again are hurting.
As relates to the Russell 2000 (1133.69), during the post-FOMC sell-off in the second half of September, it was the only one of the major U.S. indices to have undercut the August lows. It managed to rally six percent from the September 29th low, but that was not enough to bring it to the nearest resistance – at 1160ish (Chart 5). The falling 50-day moving average is right above, at 1167.55.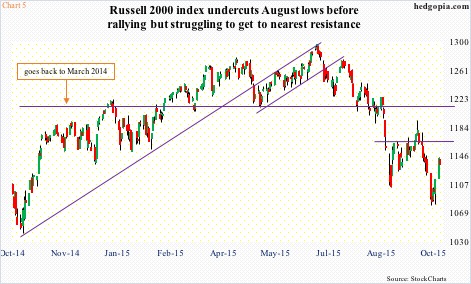
From bulls’ perspective, the good thing is that on all these indices, and others, shorter-term averages are either beginning to rise or flattish. But the real one to watch is the afore-mentioned resistance.
Staying with the S&P 500, only when 1990ish is conquered would we probably see short-covering in earnest. We need some genuine buying, not just FOMO, for that to happen.
Thanks for reading!
