
There is a trade brewing on GLD, the SPDR Gold Trust ETF.
First some background.
Ever since gold peaked in September 2011, the metal has lost its luster. Back then, GLD had $77.7 billion in assets, becoming the ETF with most assets, higher than SPY, the S&P 500 SPDR ETF. By this May, GLD had a mere $27.4 billion, and SPY had climbed back to the top with $177 billion (courtesy of ETF.com).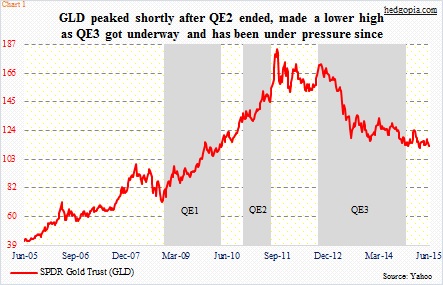
The yellow metal peaked at $1923.70/ounce (GLD at 185.85) shortly after QE2 ended. Earlier, it bottomed in July 1999 at $253 and was already on a rally mode before the Fed unveiled quantitative easing in November 2008. Gold rallied vigorously during both QE1 and QE2 (Chart 1), and came under pressure as QE2 ended. The post-QE2 drop was not a big surprise given the preceding strong rally. But when it failed to rally as QE3 got underway, that took many by surprise.
For nearly two years now, GLD (112.57) has gone sideways to slightly down (Chart 2). Rally attempts have consistently been stopped by a downtrend line going back to August 2013. Support at 114.50 goes back two years, which has now been lost. The ETF is below both its 50- and 200-day moving averages.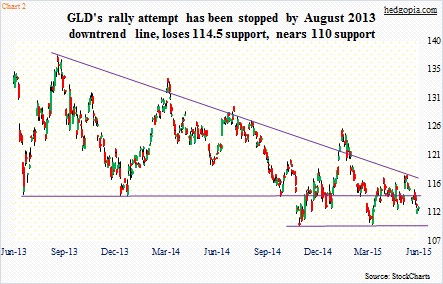
It is difficult to get bullish on gold, come to think of it. The August 2013 trendline will be broken to the upside around 116.50, which also approximates GLD’s 200-day moving average. But it is a long way off. It feels like the metal is headed for another leg lower before it gets on another persistent run higher.
As of mid-May, short interest on GLD was at a two-and-a-half-month low of 10.2 million, down from 15.3 million a month ago. On the one hand this can be viewed as shorts not seeing much downside risk, on the other hand, as far as gold bugs are concerned, this also points to a lack of potential short-squeeze fuel.
Having said all this, the ETF saw $902 million in withdrawals in May, yet gold rose 0.6 percent in the month. In other words, it is holding its own. It is also approaching seven-month lows and near the lower end of its Bollinger Bands. Daily conditions are oversold. Non-commercials are staying positive. They are net long north of 100,000 contracts in gold futures (Chart 3).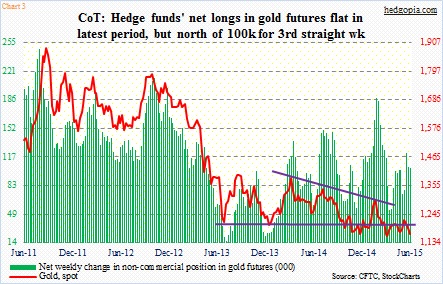
The bottom line is this. It is probably premature to get wildly bullish on gold intermediate- to long-term, near-term is another matter. The near-term path of least resistance on GLD is up. The first hurdle is resistance at 114.50, which also approximates its 50-day moving average.
This probably sets up well for a cash-secured put. June 111 puts (nine days to go) are selling for $0.55. The idea is to collect the premium. If exercised, it is an effective long at 110.45, which is not that far away from five-year lows of last November.
Thanks for reading!
