
In 2016, the so-called January barometer – the hypothesis that the first month sets the tone for the year – failed to deliver.
The S&P 500 large cap index lost 5.1 percent last January, and was down 10.1 percent by the time it bottomed on February 11.
Yet, when it was all said and done, 2016 turned out to be an above-average year. The S&P 500 was up 9.5 percent. (Post-U.S. presidential election alone, it added 4.6 percent.)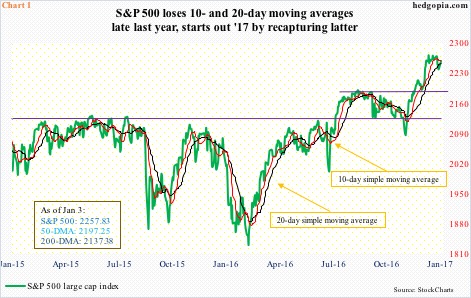
In 2015, the S&P 500 began to sell off on December 29 from an intra-day high of 2081.56. By January 20, 2016 it made an intra-day low of 1812.29.
In 2016, the index began to weaken from an intra-day high of 2273.82 on December 27 (lower high versus the all-time high 2277.53 on December 13). In the next three final sessions of 2016, it dropped to 2233.62 before closing the year at 2238.83, in the process also losing important shorter-term moving averages (Chart 1).
From this perspective, January barometer or not, the opening week this year may leave clues as to how January may fare.
The question is, can the bulls recapture the shorter-term moving averages?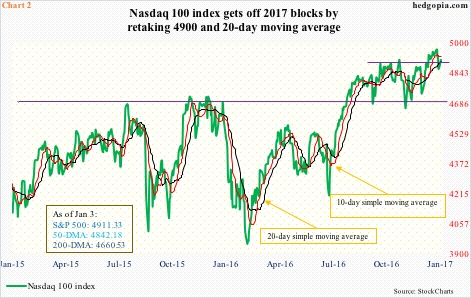
Of major U.S. indices, the S&P 500, the Nasdaq 100 index, and the Russell 2000 small cap index last week lost both 10- and 20-day moving averages. The Dow Industrials lost the 10-day, but not the 20-day.
The Nasdaq 100 also sits very close to its 50-day moving average, which is flattish. On other indices mentioned here, that average is still rising.
Last Tuesday, in what looked like a shooting star session, the Nasdaq 100 rose to a new all-time high of 4992.08, but only managed to close at 4965.81. In the next three remaining sessions of 2016, it lost both 10- and 20-day, and in the process also lost important support at 4900 (Chart 2).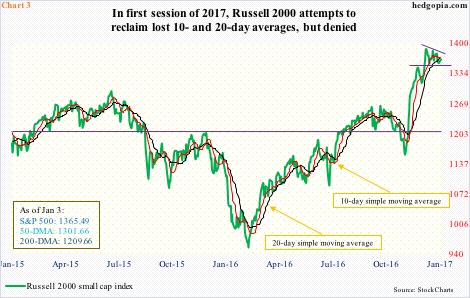
On the Russell 2000, a new all-time high of 1392.71 was recorded on December 9. Since then, it has been making lower highs. In the last three sessions last year, it lost both 10- and 20-day. From the bulls’ perspective, the good thing is, since that peak, it also carved out support at 1350-ish, which is yet to crack (Chart 3).
To be clear, all these indices are above crucial support. They are also above both 50- and 200-day moving averages. So, medium- to long-term, the trend remains up. Shorter-term is another matter.
For instance, between intra-day low and high on November 3 and December 9, the Russell 2000 rallied north of 20 percent – and north of 16 percent post election through that all-time high. Importantly, though, as stated above, since that peak, it has made several lower highs, including one yesterday.
Also yesterday, the Russell 2000 rallied 0.6 percent, and at one time had rallied enough to retake both 10- and 20-day, but closed lower. The S&P 500 rallied 0.9 percent to reclaim its 20-day, closing just a tad under its 10-day. Similarly, the Nasdaq 100, up one percent, was rejected at its 10-day, but was able to recapture 20-day as well as 4900.
All these averages have not yet developed a bearish cross-under, and are within reach for equity bulls to reclaim. With the VIX having been rejected at its 50- and 200-day, they probably hold the edge.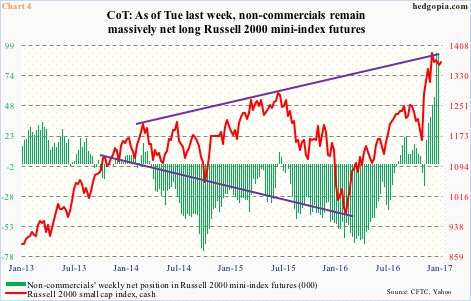
A failure, however, raises the risk that support at 1350-ish on the Russell 2000, for instance, eventually gives way. This in turn raises the odds that non-commercial traders – who tend to be trend followers – will begin to unwind their massive net longs in Russell 2000 mini-index futures.
As of the week ended December 20, they held 92,433 net longs – a record. In the following week, holdings went down slightly to 91,339, but these traders remain massively net long. They rode the rally perfectly (Chart 4). That said, since December 6, the Russell 2000 (cash) has essentially gone sideways, even as net longs rose by 85 percent. Hence the risk – the risk of these traders deciding to lock in profit.
And hence the significance of the averages in Charts 1, 2, and 3, and their role in determining the near-term trend.
Thanks for reading!
