
Equities are choppy. The S&P 500 large cap index (2099.68) is essentially flat for the week. Participation is thin. Volume is anemic. Fresh on the heels of last week’s breakouts, indices are trying to build on those gains. But conviction is lacking. Both Tuesday and Wednesday, late-session action saved the day from getting worse.
Greece dominates the headlines. Understandably, what comes out of there likely ends up dictating near-term action. Assuming the uncertainty gets resolved, the question is what happens after the initial feel-good effect wears off?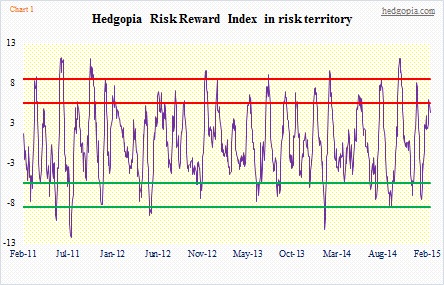
Chart 1 gives us some idea.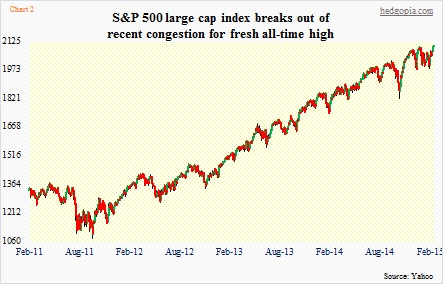
This is an index I just created. It is meant to measure buying versus selling pressure in U.S. equities – and odds of a potential reversal thereof. The signal generated is not long-term, but short- to medium-term – lasting weeks at most, not months.
For calculation, it uses daily numbers, encompassing data that range from market internals to sentiment to options.
As can be imagined, once the violet line drops down to the green (reward) zone, things have gotten oversold, raising the odds of a bounce/rally. As it rises to the red (risk) zone, they are overbought.
I have placed Chart 2 right underneath the index, so we get an idea if it works. It does a fairly good job. There have been misfires. No surprise there. No system is perfect. The index, for instance, hit the upper end of that green boundary early October. Stocks only bottomed in the middle of that month. There have been other complete misses.
I will continue to work on it, see if it can be improved. The idea is not to try to create one that works 100 percent of the time but something that throws light on the tradeoff between risk and reward at any point in time.
From this perspective, risk is beginning to rise.
The index peaked Tuesday and is beginning to hook down. With that said, a signal has tended to be much more reliable if it drops from the upper end of the red zone, or even beyond. Any chance it reverses and heads back up toward the upper end of the zone? It is always possible.
In fact, in the intermediate-term, there is room for several technical indicators I track to move up before they get overbought. So in one scenario, it is possible equities continue to rally and peak sometime next week before a decent decline gets underway. In this scenario, the violet line in Chart 1 probably moves higher as well.
But that is a ‘woulda coulda shoulda’. What the index is telling us now is that risk is on the rise.
