
ITB, the iShares U.S. home construction ETF, cannot get it going.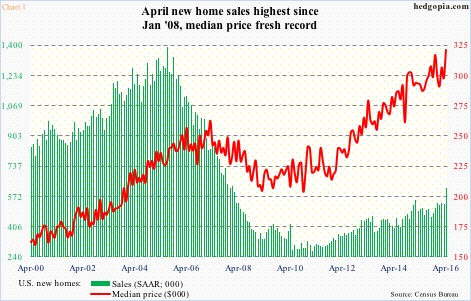
On May 24th, it surged 3.8 percent with massive volume. The ETF was reacting to April’s new home sales, which surged 16.6 percent month-over-month to a seasonally adjusted annual rate of 619,000 units – the highest since January 2008. The median price shot up to a record $321,100 (Chart 1). What was not to like?
This came on the heels of April’s decent existing home sales, which were up 1.7 percent m/m to a SAAR of 5.45 million units but essentially on par with the cycle high 5.48 million units last July (Chart 2). The median price rose five percent to $232,500 in April, merely 1.6 percent from the all-time high $236,300 last June.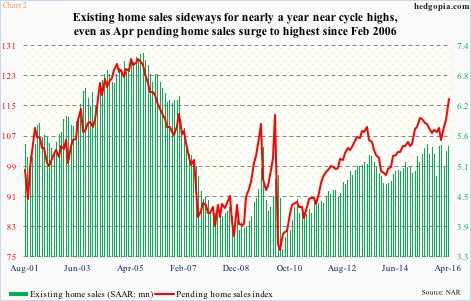
On May 25th, ITB continued to show strength early on, rallying 1.6 percent intra day to $27.93 but closing the session down 0.2 percent. The session produced a shooting star. This is the kind of candle that can signal a potential top/reversal (blue arrow in Chart 3).
The reversal came just under one-plus-year resistance at $28.
The ETF has been range-bound between $26 and $28 for a while now, with support going back three years. Bulls defended that support for nearly three weeks before bolting higher, toward $28 (Chart 3). Thus far, that ceiling stands.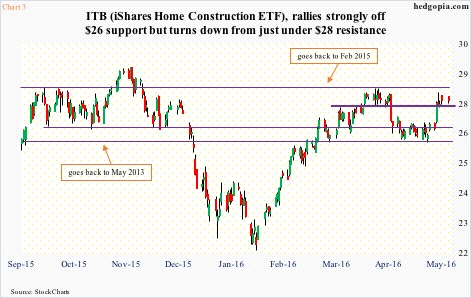
Then on May 26th, pending home sales were released for April, and essentially confirmed what new and existing home sales were showing. The pending home sales index shot up 5.6 points m/m to 116.3. This was the highest reading since February 2006 (Chart 2).
Pending home sales lead existing home sales as these are based on contract signings. More good news to come in existing home sales, then? Possibly. New home sales already broke out of months-long sideways move (Chart 1). Existing home sales could do the same, as they have essentially gone sideways for nearly a year near cycle highs (Chart 2).
All this good news, yet ITB cannot break out of its range.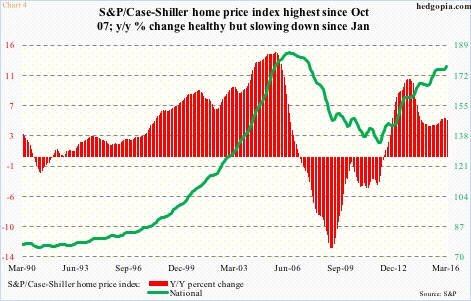
This phenomenon was at work again yesterday. The S&P/Case-Shiller home price index was published for March (Chart 4). Growth was healthy. Nationally, prices rose at an annual rate of 5.15 percent, slower than January’s 5.41-percent pace, but much higher than prevailing consumer inflation.
Yet all ITB ($27.59) could do yesterday was rally to $27.78 intra-day before selling off.
These are enough tea leaves to read from.
With the ETF having rallied nearly eight percent intra-day in five sessions through the afore-mentioned shooting star session, daily technicals are overbought. The recent rally has pushed ITB past both 50- and 200-day moving averages, but rally attempts are being repelled near the upper Bollinger Band.
Plus, there is the $28 resistance. Its inability to stage a breakout in the face of all this good news could very well be markets’ way of saying things probably could not get any better in housing near-term.
Combine this with overbought technicals, ITB’s probable path of least resistance is down. Shorts probably have better odds of succeeding than longs – at least near term.
Thanks for reading!
