
From the mid-May high of $49.75 to the low this Monday of $47.46, XLP, the SPDR Consumer Staples ETF, quickly lost 4.6 percent. In three weeks! Monday produced a doji, right around its 200-day moving average. By that time, daily conditions had gotten grossly oversold.
That doji came a day earlier than on a whole host of indices including the S&P 500, the Dow Industrials, the Nasdaq Composite as well as several sector ETFs.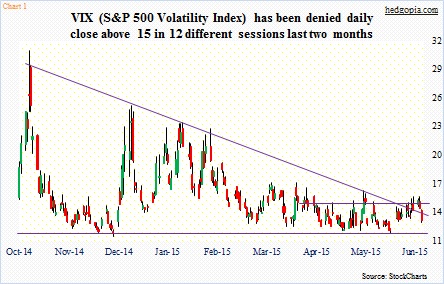
VIX, the S&P 500 Volatility Index, has tried and failed to take out 15 for over two months now (Chart 1). In five of the six sessions through Tuesday, rally attempts were rejected at that level. RVX, the Russell 2000 Volatility Index, was similarly getting rejected at 18.
All this was setting up well for a bounce in equities. Yesterday was witness to this coiled-spring effect.
Once again, rather curiously XLP led stocks in general. The ETF started rallying Tuesday. In some ways, this was expected given the preceding quick and sharp move lower – further supported by VIX’s inability to push through 15.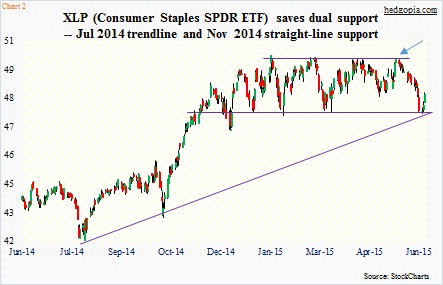
Earlier, XLP’s sharp three-week drop came on the heels of its inability to take out five-month resistance in the middle of last month (blue arrow in Chart 2). This was bulls’ fourth assault on that resistance – just under $50. The subsequent selling was probably a result of both bulls getting fed up and shorts getting aggressive. During the May 15-29 period, short interest jumped 22 percent to 37.7 million (Chart 3).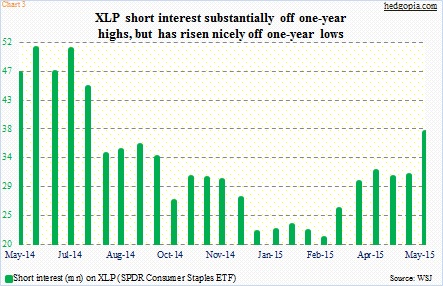
To bulls’ credit, they stepped up where needed. As seen in Chart 2, the low this week came right on the July 2014 trendline. That area is also where a seven-month horizontal support lies.
In the right circumstances, there is room for the ETF to rally further. The 50-day moving average lies at $48.98, 1.5 percent away.
At the same time, it is difficult to get overly bullish on XLP.
Its top five holdings (with respective weights) are: Procter & Gamble (PG), 12.2 percent; Coca-Cola Co (KO), 9.1 percent; Phillip Morris International (PM), 7.2 percent; CVS Health Corporation (CVS) and Wal-Mart Stores (WMT), 6.6 percent each.
Of these, PG, KO and WMT are below their respective 50- and 200-day moving averages, with death crosses on both. PM was under both those averages, but yesterday wrestled back above the 200 and closed right on the 50 (there is now a golden cross). CVS, too, rallied back above its 50-day.
As the ETF went sideways for five months before succumbing to selling pressure three weeks ago, there has been gradual deterioration in several leading names.
With that said, there are signs of stability near-term. If nothing else, odds of an oversold bounce look decent. The ETF has already rallied 1.7 percent off Monday’s lows. So rather than jump on the bandwagon now and risk a reversal, a cash-secured put can be structured to effectively go long near those lows.
June (seven days to go) 48 puts are selling for $0.35. If the ETF ($48.27) rallies, fine, collect the premium. If it comes in, the dual support in Chart 2 comes into play again. If bulls are unable to save this, they will have a lot more to worry about – not just XLP but stocks in general. Otherwise it is an effective long at $47.65.
Thanks for reading!
