
Dividend income is an important source of income. In 1Q16, it increased 1.3 percent year-over-year to a seasonally adjusted annual rate of $874.3 billion, down from $876.9 billion in the prior quarter. Dividends made up 5.6 percent of U.S. personal income – not massive, but decent. Personal income was $15.7 trillion during the quarter.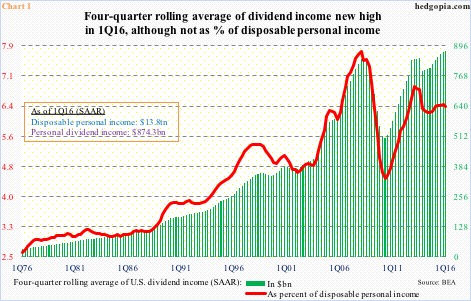
Chart 1 plots a four-quarter rolling average of dividend income, and at $871 billion it was at a new record.
Dividend income can also be looked at vis a vis disposable personal income. On this score, the former in 1Q16 was only marginally higher versus 2008 highs, although the latter enjoyed much faster growth. Disposable personal income grew from $11.2 trillion in 2Q08 to $13.8 trillion in 1Q16. This discrepancy is evident in the red line in Chart 1.
Dividend income may not have kept pace with disposable personal income, but the fact remains that it is a sizable amount.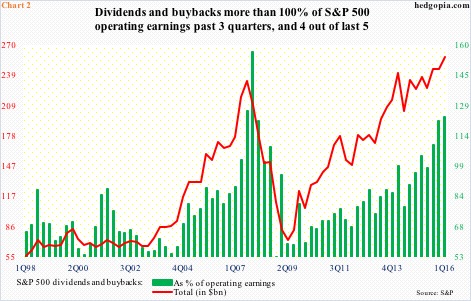
S&P 500 companies paid $96.3 billion in dividends in 1Q16, down from $99.4 billion in 4Q15 but up from $93.6 billion in 1Q15. This respectively made up 46.1 percent, 49.2 percent and 40.9 percent of operating earnings. Meeting these payments should not be an issue.
However, dividends are just one side of the ‘shareholder return’ equation. The other is buybacks. The latter was $161.4 billion in 1Q16, second only to a record $171.9 billion in 3Q07. The four-quarter rolling total of $589.4 billion in 1Q16 was a new record, past the prior high of $589.1 billion in 4Q07.
More important, these two – dividends and buybacks combined – were a record $257.7 billion in 1Q06 (Chart 2). This is where it gets interesting. The combined total made up 123.3 percent of operating earnings during the quarter. In fact, this was the third quarter in succession that dividends and buybacks exceeded operating earnings… and in four out of the last five.
Corporate aggression in ‘shareholder return’ comes amidst operating earnings that have peaked and are in decline. Earnings peaked at $262.9 billion in 3Q14, and have since dropped 20.5 percent to $209 billion in 1Q16.
It is never a good combo – input decreasing and output increasing.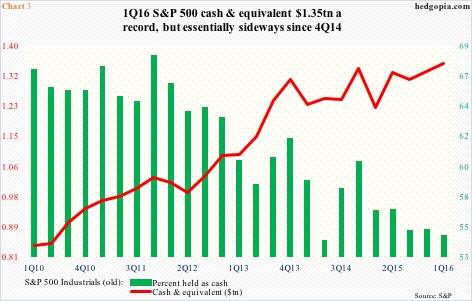
In Chart 3, the red line represents S&P 500 companies minus the ones in financials, utilities, and transportation. These three tend to have high cash reserves. On this basis, cash & equivalents were $1.35 trillion in 1Q16 – a new record. At the same time, also worth noticing is the rather sideways pattern since 4Q14. Secondly, corporations have also been relying on debt to buy back shares in particular. But ultimately, these things have to be funded through earnings. And on this score, things are stretched.
Back in 2007/2008, there were six straight quarters of dividends and buybacks exceeding 100 percent of operating earnings, before the house of cards fell. This time around, if we include 2Q15’s 97.9 percent, it has been five straight. Once again, things are extended.
If corporations are forced to decide between dividends and buybacks, odds favor they favor the former. Once dividends are in place, companies try to maintain dividend-paying record. By extension, this implies the current pace of buybacks is at risk.
Thanks for reading!
