
Here is a brief review of period-over-period change in short interest in the February 16-28 period in the Nasdaq and NYSE Group as well as nine S&P 500 sectors.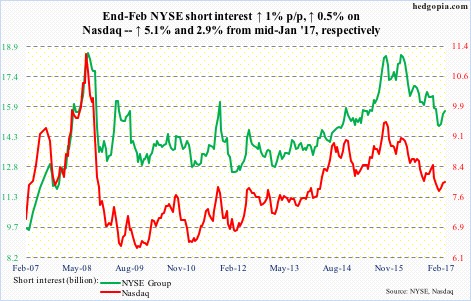
Nasdaq – short interest ↑ 0.5% p/p; Nasdaq composite ↑ 0.1%
The Nasdaq (5838.81) has been under pressure since it gapped up on March 1 to a fresh intraday high of 5911.79, which the bulls are struggling to build on.
Shorts have been adding since mid-January. They will feel better should the composite lose 10- and 20-day moving averages; it is caught between the two currently. After that, there is another three percent before the 50-day moving average is tested.
NYSE Group – short interest ↑ 1% p/p; NYSE composite ↓ 0.02%
The NYSE (11457.64) has already lost its 10- and 20-day. The 50-day is merely 1.1 percent away … probably only a matter of time before it is tested. Underneath, there is support at 11100-11200, which the bulls must save. Otherwise, shorts lick their chops.
…
XLB (SPDR materials ETF) – short interest ↓ 2.9% p/p, ETF ↓ 0.4%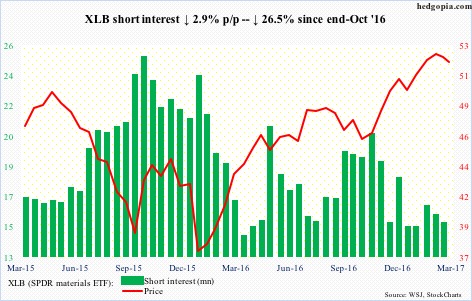
On Thursday, XLB ($51.87) tested the 50-day ($51.70). Slightly underneath, there is another support at $51 and change. Down below, $50 is a must-save, which, if lost, is likely to embolden shorts.
XLE (SPDR energy ETF) – short interest ↓ 2.5% p/p, ETF ↓ 2.7%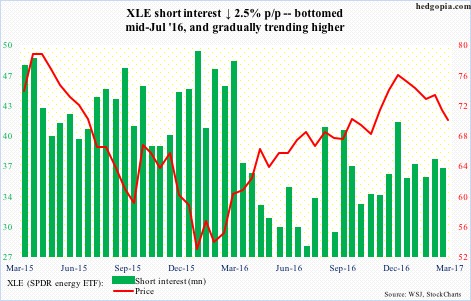
Wednesday’s 2.6-percent drop in XLE ($70.11) cost it the 200-day. The ETF has been trading within a declining channel for three months, and led Wednesday 5.4-percent collapse in spot West Texas Intermediate crude.
Thursday, it rallied 0.7 percent to close right underneath the 200-day. A squeeze is possible should a rally ensue.
XLF (SPDR financial ETF) – short interest ↑ 19.9% p/p, ETF ↑ 0.1%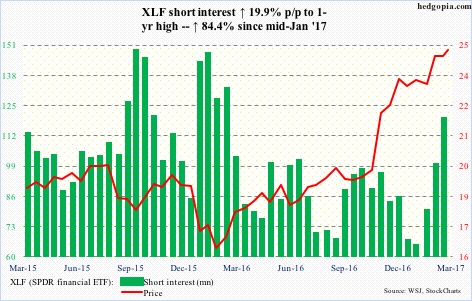
Since post-election break out of $20 last November, XLF ($24.81) has been on a tear, but is showing some signs of fatigue. Probably why shorts are getting aggressive. If they have their way, the ETF will test support at $23.75, which also approximates the 50-day ($23.86). Medium-term, unless $20 is lost, bulls need not worry much.
That said, there is also a risk of a double top – $25.30 early this month versus $25.40 in May 2007.
XLI (SPDR industrial ETF) – short interest ↑ 5.7% p/p, ETF ↑ 0.2%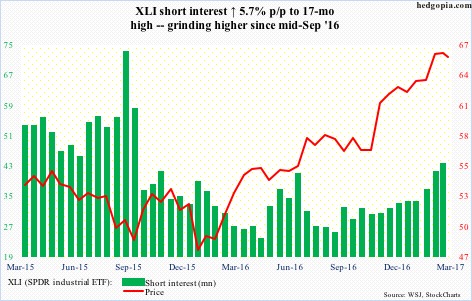
Last week, XLI ($65.44) produced a weekly shooting star. This follows a massive rally post-election. There was a major breakout at $56, which is not going to get tested any time soon. Shorts’ odds go up if bulls are unable to defend $63.75, which approximates the 50-day ($64.28).
XLK (SPDR technology ETF) – short interest ↑ 4.7% p/p, ETF ↑ 0.9%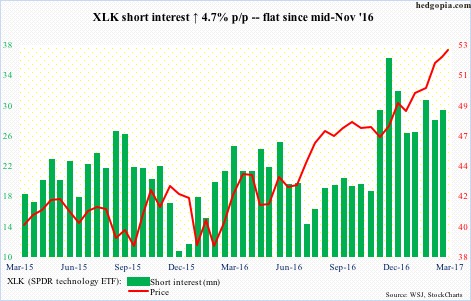
XLK ($52.83) just might be ready to come under some pressure. It is up to the bears how far they can push it. They are positioned for it, short interest-wise.
XLP (SPDR consumer stables ETF) – short interest ↓ 14.6% p/p, ETF ↑ 1.8%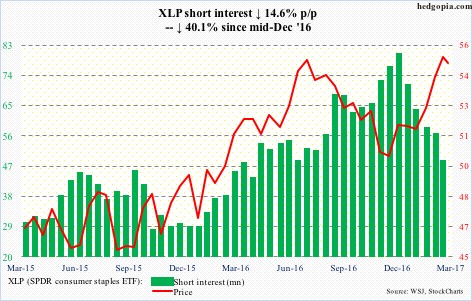
Last July, XLP ($54.80) began to drop after a weekly doji. Once again, last week was a doji, retreating from the same level. A double top in the making? Needs to break $50 for that. For now, the ETF is itching to go lower.
XLU (SPDR utilities ETF) – short interest ↑ 11.5% p/p, ETF ↑ 5.5%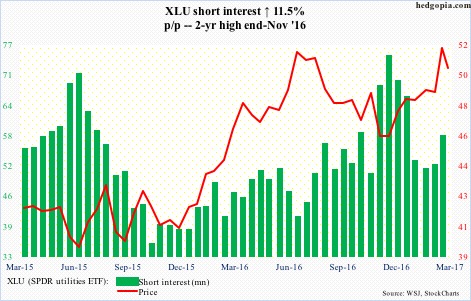
XLU ($50.54) has the same setup as XLP – a long-legged doji last July as well as last week around $52 – and wanting to go lower, at least near term. Decent support lies at $48.50-$49. The 50-day lies at $49.36.
XLV (SPDR healthcare ETF) – short interest ↓ 1.4% p/p, ETF ↑ 1.8%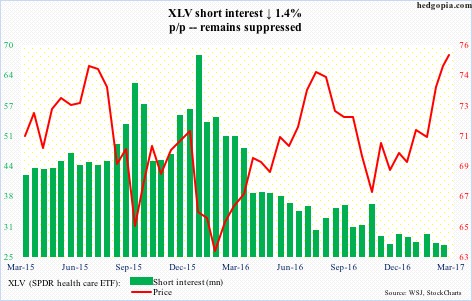
XLV ($75.69) is testing resistance from July 2015 and August 2016. This follows a five-week rally that began in late January. There is decent support at $72, which also approximates the 50-day ($71.91). A breakout would be massive. Shorts are acting as if they expect one.
XLY (SPDR consumer discretionary ETF) – short interest ↓ 10.2% p/p, ETF ↓ 0.5%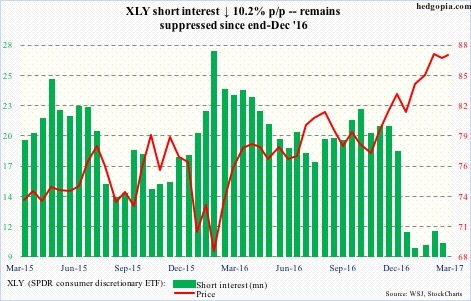
So far this week, XLY ($86.72) has a weekly doji. This was preceded by two back-to-back long-legged doji. It is tired. That said, shorts continue to take it easy and not go aggressive – yet.
Thanks for reading!
