
Here is a brief review of period-over-period change in short interest in the March 15-31 period in the Nasdaq and NYSE Group as well as nine S&P 500 sectors.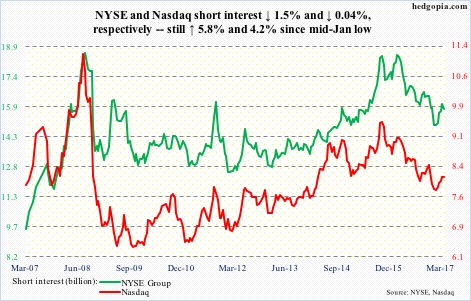
Nasdaq – p/p, short interest ↓ 0.04%, Nasdaq composite ↑ 0.9%
On March 1, the Nasdaq composite (5866.77) made a high of 5911.79, which was then superseded on March 21 (5928.06) and on April 5 (5936.39). The 5900 level has proven tough to crack. A breakout probably sets off a squeeze.
That said, shorts are yet to get any traction. On Tuesday, they were able to push the index slightly below the 50-day moving average, which the bulls defended in a hammer session. Range-bound action continues.
NYSE Group – p/p, short interest ↓ 1.5%, NYSE composite ↑ 0.3%
The NYSE composite (11473.62) has been trading along a declining trend line since March 1 when it recorded an intraday high of 11687.07. The good thing, from the bulls’ perspective, is that the 50-day moving average, which they have clung on to for the past three weeks, is providing support, including yesterday.
Down below, there is support at 11100-11200 – a must-save.
…
XLB (SPDR materials ETF) – p/p, short interest ↑ 3.1%, ETF ↑ 1.5%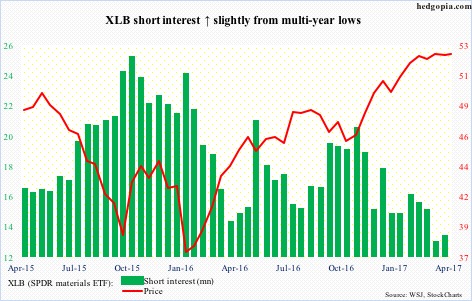
XLB (52.46) is flat as a pancake since it broke out on January 24 – caught in a two-point range. The 50-day moving average, which provided support yesterday, is beginning to go flat.
Should it manage an upside brekaout, there is little chance of a meaningful squeeze. Short interest is at multi-year lows.
XLE (SPDR energy ETF) – p/p, short interest ↓ 10.2%, ETF ↑ 1.6%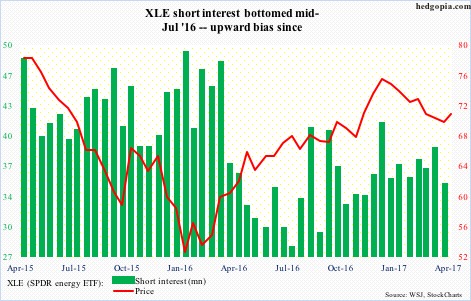
XLE (70.90) has broken the mid-December ’16 declining channel as well as recaptured the 200-day moving average, which was successfully tested yesterday.
Bulls and bears are toughing it out at the 50-day. Should the former succeed, short interest is high enough to cause a mini-squeeze.
XLF (SPDR financial ETF) – p/p, short interest ↓ 19.1%, ETF ↓ 3.9%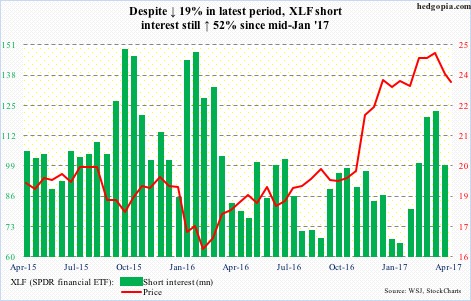
XLF (23.39) peaked on March 2 at 25.21. Short interest bottomed mid-January, rising to a 13-month high by mid-March. These new shorts have done well, and probably will continue to as long as the ETF remains under support-turned-resistance 23.70.
XLI (SPDR industrial ETF) – p/p, short interest ↑ 0.2%, ETF ↑ 0.3%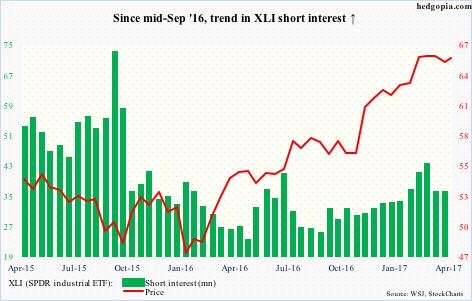
XLI (65.38) has straddled the 50-day moving average since March 21 – give and take. The daily MACD just had a bullish crossover, even as the Bollinger band is tightening. Short interest has risen the past seven months, but nothing major.
XLK (SPDR technology ETF) – p/p, short interest ↑ 1.3%, ETF ↑ 0.9%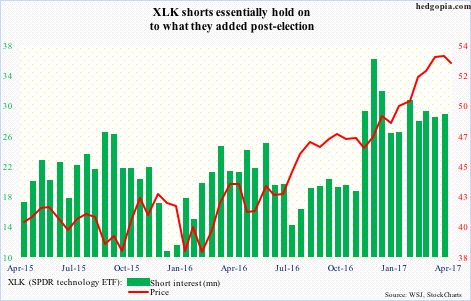
XLK (52.76) longs continue to deny shorts of an opening, having defended the 50-day moving average yesterday. The latter aggressively added post-election and are staying put … they might have a chance if a potential MACD cross-under on the weekly chart completes.
XLP (SPDR consumer stables ETF) – p/p, short interest ↓ 14.9%, ETF ↓ 0.1%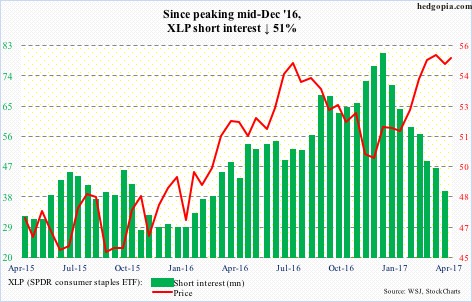
Elevated short interest acted as a big tailwind since XLP (54.88) began to rally early December last year. That said, the $55 level continues to be tough to break – even with all the help coming from shorts. Since mid-Dec last year, short interest is down 51 percent.
XLU (SPDR utilities ETF) – p/p, short interest ↓ 26.1%, ETF ↑ 1.3%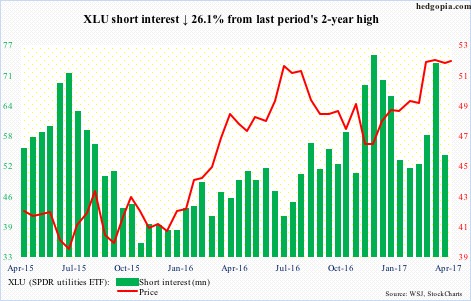
For the past month and a half, XLU (51.47) trend has been flat to slightly up. Bulls are working hard to deny shorts of a double top. Should a breakout occur, squeeze fuel is decent.
XLV (SPDR healthcare ETF) – p/p, short interest ↓ 17.3%, ETF ↓ 1.3%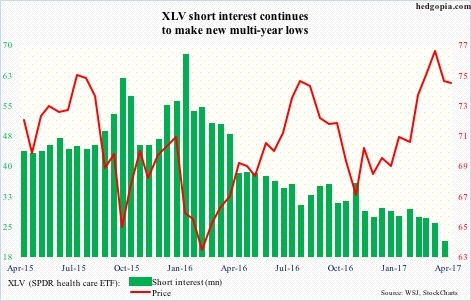
Mid-March, XLV (74.17) bulls forced a breakout – past prior highs of July 2015 and August 2016 – but that proved fleeting, possibly because there was so little fuel for squeeze.
XLY (SPDR consumer discretionary ETF) – p/p, short interest ↓ 4.6%, ETF ↑ 1.3%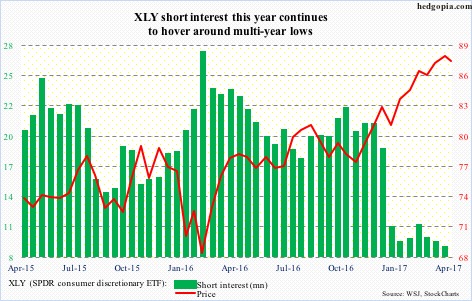
Since they cut back big during the December 15-30 period last year, XLY (87.51) shorts are lying low. And the ETF continues to grind higher, though ever so slightly of late. Near-term, $87 needs to hold.
Thanks for reading!
