
Today completes one year since the S&P 500 large cap index made an all time high of 2134.72.
On this anniversary, U.S. stocks’ near-term outlook is not as clear as is probably its medium-term.
In the medium term, major indices are probably headed lower. From rapid earnings deceleration to macro slowdown to growing hawkish tone within FOMC, it is hard to make a strong fundamentally driven bullish case.
At/near February 11th lows, the technical case to go long was strong. Almost all indicators – on a daily and weekly basis in particular – were in gross oversold territory. After massive rallies off of those lows, ‘oversold’ has turned into ‘overbought’.
Weekly momentum indicators on major indices are rolling over, and have a ways to go before these conditions are unwound.
It is just a question of whether the act of unwinding continues on or pauses right here. Major indices are at perfect spot for the latter scenario to unfold.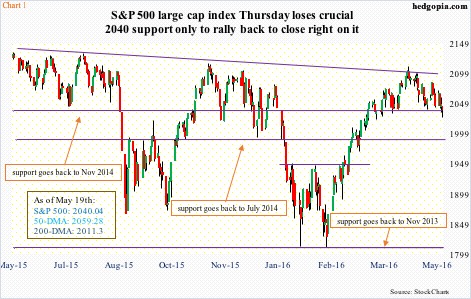
The S&P 500 large cap index on April 20th was repelled at a trend line drawn from the afore-mentioned peak of last year (Chart 1). From that high through the intra-day low yesterday, it shed four percent, and is currently sitting right on support going back to November 2014. This support is doubly important as it approximates the neckline of a head-and-shoulders formation. Should the pattern complete, we are probably looking at further weakness.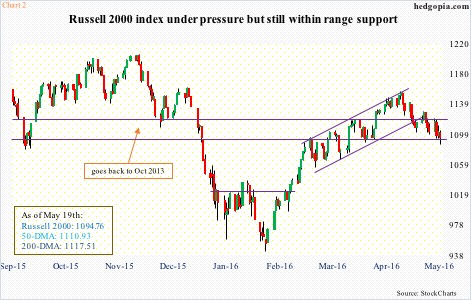
The Russell 2000 small cap index is at a similar crucial juncture. It peaked in June last year, and most recently on April 27th (lower highs). Since the recent high through the intra-day low yesterday, it dropped 6.1 percent, losing both 50- and 200-day moving averages in the process. In the five sessions through Wednesday, these averages persistently denied rally attempts.
That said, the Russell 2000 has not yet lost the 1090-1120 range, which goes back to October 2013 (Chart 2). Should small-cap bulls decide to put their foot down, this is a perfect spot to do so.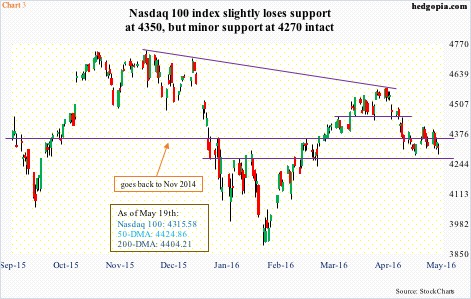
There is a similar dynamic at work on the Nasdaq 100, which retreated in November last year after scoring an all-time high. Its recent high was on April 19th – once again, lower highs – and lost 6.4 percent through the intra-day low on May 6th. As is the case with the Russell 2000, the Nasdaq 100 has lost both its 50- and 200-day moving averages.
Yesterday, it lost 4350, which goes back to November 2014, but not support at 4270 (Chart 3).
These are make-or-break levels near-term. Should indices break down, this would probably be most prominently reflected in Chart 4.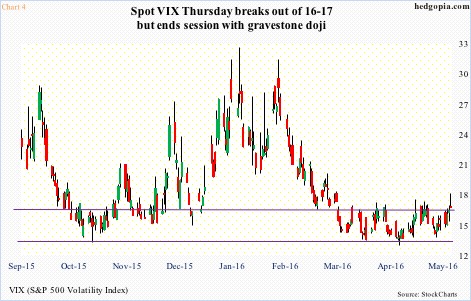
Spot VIX (16.33) has been bound by 16-17 for a couple of months now. This is an important level going back two decades. Historically, once VIX gets over this resistance, it has tended to rally – rally good. But first it has to get over that ceiling, and that probably does not happen until the three indices above fail to save their respective support levels.
Yesterday, VIX did shoot up to 17.65 intra-day but gave most of it back by close, producing a gravestone doji in the end. Ordinarily, this can mean the trend is nearing a turning point, which in this case implies the S&P 500 for now does not break down. Fingers crossed!
Thanks for reading!
