
If there has been one common thread shared by major U.S. indices before the rout this Monday, it is this: the sell-off preceded a trendline break.
Back in the middle of October last year, as the S&P 500 Index was just a hair’s breadth away from losing 10 percent, stocks bottomed. Turns out it was an important bottom.
From intra-day low to high since that bottom, indices all enjoyed a nice run over a period of six to seven months – the S&P 500 (2063.11) up 17 percent, the Dow Industrials (17619.51) up 16 percent, the NYSE Composite (10805.2) up 14 percent, the Nasdaq 100 (4396.76) up 23 percent, and the Russell 2000 Index (1253.95) up 25 percent. In the meantime, VIX, the S&P Volatility Index, tumbled 62 percent.
Pullbacks since that October bottom consistently found support on that trendline. There were minor breaks along the way, but nothing major. Post-breakdown, bulls stepped up near other support levels, and the trendline held. Until it did not.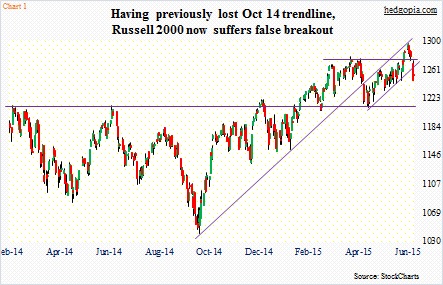
Among the indices mentioned above, the first to lose that was the Russell 2000. That took place late April. The subsequent decline found support on one-year horizontal support, followed by a sharp rally, ultimately resulting in a breakout nine sessions ago. Turns out it was a false breakout (Chart 1).
A false breakout is another common thread.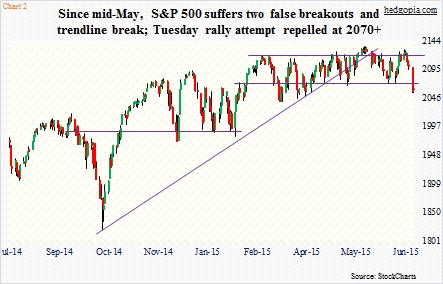
During the last month and a half, the S&P 500 has suffered two false breakouts – one in mid-May and the other a month later. In the meantime, it has gone on to lose the mid-October 2014 trendline (Chart 2).
The NYSE Composite is not an exception. It lost that trendline early June (Chart 3). As with the S&P 500 and the Russell 2000, it too had its share of false breakouts. Resistance at 11100 goes back a year. A successful breakout can have huge repercussions from the perspective of the bull market’s health. But as things stand now, we have a breakdown.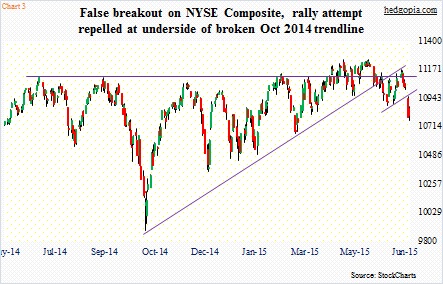
Of the five indices above, the Nasdaq 100 was the last one to lose that trendline. This took place three weeks ago (Chart 4). The tech-heavy index failed to take out 4560 in three attempts in a span of two months. The third time it failed at that resistance, it also faced resistance at the underside of that broken trendline.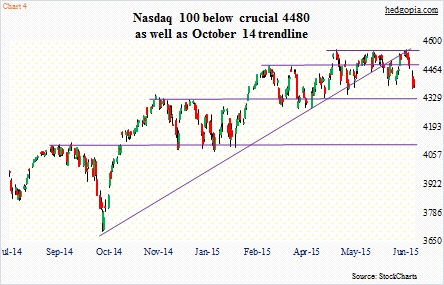
This is another common thread.
After a trendline is broken, it is normal for a subsequent rally to find resistance at the underside of the broken trendline. Besides the Nasdaq 100, we saw this play out on both the NYSE and Russell 2000. On the latter in particular, that is where the post-breakout rally stopped.
On the Dow Industrials, after it lost the trendline and subsequent decline, it did rally up to old horizontal resistance and failed (Chart 5). The underside of that broken trendline was never tested. As is true with other indices, it too had its share of false breakouts.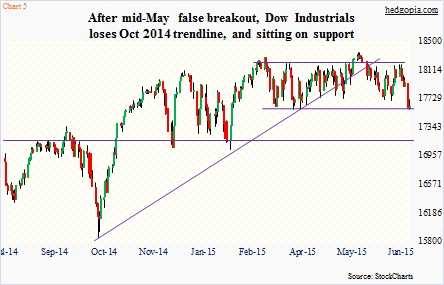
What next then? Below are some levels to watch and where indices stand currently.
S&P 500: On Monday, it lost support at 2070, give and take. Tuesday, that resistance was tested – unsuccessfully. Currently, the index is right above its 200-day moving average. The last time this average was tested was February. So it likely would not lose it right away. With that said, the index needs to retake 2070. The sooner the better.
Russell 2000: Back in February, the index tested its 200-day moving average. But unlike the S&P 500 which is retesting it, the Russell 2000 currently finds itself substantially above the average. In fact, the index is right at its 50-day moving average. By the look of things, support at 1210 likely is in play – eventually. There is resistance at 1270.
Nasdaq 100: Support at 4480, which also approximates the 50-day moving average, is gone. Now it is resistance. The 4300-4350 level is a must-hold.
NYSE Composite: It is trading below both 50- and 200-day moving averages.
Dow Industrials: It too is trading below 50- and 200-day moving averages, and is right at support at 17600.
There is no doubt the Monday sell-off has wrought technical damage. Were transports sending the right signal all along then, when it came it to the U.S. economy? The Dow Jones Transportation Average peaked seven months ago, and has lousy price action; it faces immediate resistance at 8250, followed by major resistance at 8600 (Chart 6).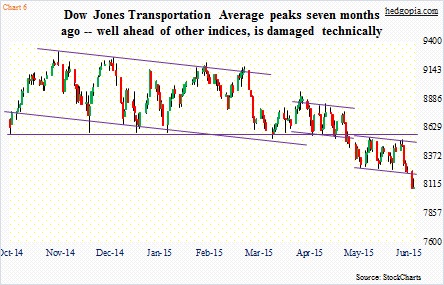
Are these indices then belatedly catching up or was the Monday sell-off merely in response to what was going on in Greece? As things stand now, even if the first scenario were right, there may be a glimmer of hope for bulls near-term. The second-quarter earnings bar is low. And there likely is no shortage of market participants who would not mind treating the recent weakness as a trading opportunity.
How VIX acts going forward in this regard is worth paying attention to – for signs of a spike buy signal. Yesterday saw a mini version.
Thanks for reading!
