
Last week when the advance report on U.S. durable goods for June was published, new orders for non-defense capital goods ex-aircraft – used as proxy for business capital expenditures – were $68.4 billion, and May was reported as $67.8 billion. A week later, yesterday, they were both revised lower – to $68 billion and $67.5 billion, respectively. Cumulatively, orders were revised lower by $794 million – not a big amount in the grand scheme of things. But it is the trend that is worrisome.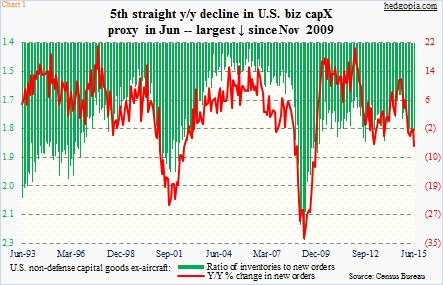
Since they peaked at $74 billion last September, orders have fallen by north of eight percent, and are struggling to regain momentum – now down year-over-year for five consecutive months. The June drop of 7.2 percent was the largest monthly drop since November 2009 (Chart 1).
If there is any consolation, it is that June was up month-over-month, after monthly declines in April and May. As well, inventory was revised lower – June from $122 billion to $121.7 billion and May from $121.6 billion to $121.3 billion. As a result, the ratio of inventories to orders ticked down from 1.8 in February to 1.79. Nonetheless, inventory remains high.
As far as business capX goes, Chart 1 is not an exception. Weak signals are coming from a whole host of other data series.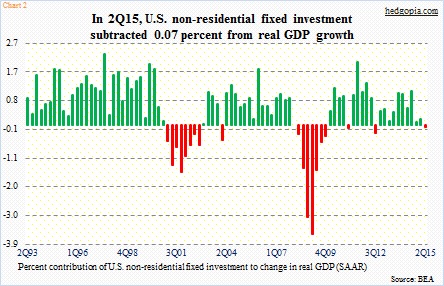
In 2Q15, real private-sector non-residential fixed investment fell at a seasonally adjusted annual rate of 0.6 percent, to $2.19 trillion – the first drop since 3Q12, when it fell 2.1 percent. The 2Q15 drop took away 0.07 percent from real GDP growth (Chart 2). In fact, 1Q15 was originally reported as the entry having subtracted 0.44 percent from real GDP growth, which has now been revised to positive contribution of 0.2 percent. As early as 3Q14, it grew at nine percent.
In the latter months of last year, something must have convinced businesses to pull in their horns. One possible reason is that the economy – on a real basis – grew 4.3 percent in 3Q14 and 4.6 percent before that. The deceleration since can be taken as an offset for the acceleration in those two quarters. Or there is something else going on.
In 4Q14, the job market was running on all cylinders, with non-farm payroll averaging 324,000 a month. FOMC officials were beginning to drop hints they would like to begin hiking rates this year. That was also when small businesses began to push back plans for wage hikes as well as capital expenditures.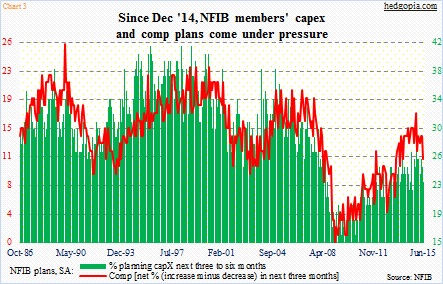
Versus past cycles, both the red and green lines in Chart 3 had already been tracking much lower. Nonetheless, they had been rising in fits and starts. The uptrend stopped last December. Since then, National Federation of Independent Business members’ comp plans have dropped from 17 to 11 and capex plans from 29 to 23.
Are we witnessing the unintended consequences of an extended easy monetary policy?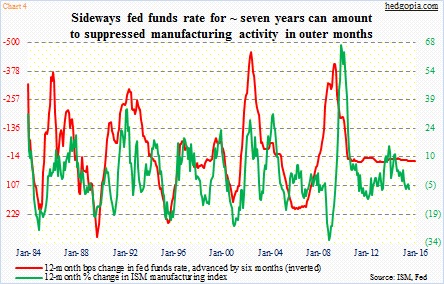
Chart 4 does a good job of depicting this possibility. Manufacturing activity, denoted by the green line, tends to follow the red line, which is inverted. Rates come down, and this acts – as it should – as a tailwind for economic activity, and vice versa. The fed funds rate has been flat for nearly seven years now, and has no room to go any lower. If the Fed does indeed end up hiking later this year, and if the relationship between the two variables hold, this can only mean one thing – further shrinkage in activity.
Even assuming the Fed does not move this year – once again, if the historical relationship in Chart 4 holds – sluggish activity probably lies ahead. The red line, which is advanced by six months, has gone sideways for too long. In the past four years, the ISM manufacturing index, with normal ups and downs, has been stuck in a range – 52.9 in July 2011 and 52.7 in July this year. Muddle-along is the new normal. The business community is probably well aware of this.
Thanks for reading!
