
One look at Chart 1 and it is easy to see what a squeeze can do to short interest.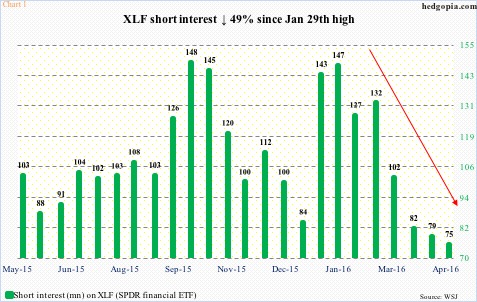
In the two weeks ended January 29th, short interest on XLF, the SPDR financial ETF, peaked at 146.8 million. The ETF traded at $21.60 then. In the next period – that is, by February 12th – short interest dropped to 127 million, and XLF made an intra-day low of $19.42 on February 11th. Evidently, shorts willingly covered. Then came the squeeze.
XLF continued to push higher, and short interest continued to go down. The ETF peaked on April 27th at an intra-day high of $23.77, even as short interest collapsed to 75.4 million by April 29th (Chart 1). Shorts were covering – only this time unwillingly. The 49-percent drop in short interest apparently lent a big hand in the 22-percent jump in XLF between the afore-mentioned intra-day low and high.
XLE, the SPDR energy ETF, is another example.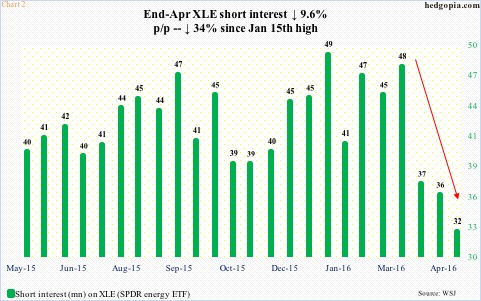
The ETF bottomed at an intra-day low of $49.58 on January 20th. Five days prior – as of the January 15th period – short interest had surged to 49.1 million, which was the highest since January 30th last year. Then came the squeeze.
Between the afore-mentioned low and an intra-day high of $68.82 on April 28th, XLE surged nearly 39 percent. Short squeeze helped big time, as short interest collapsed to 32.4 million in the latest period (Chart 2).
As a matter of fact, there are several other examples in which short interest simply collapsed during the past several periods… ITB, the iShares Dow Jones home construction ETF, being one. Between January 15th and April 29th, short interest got more than cut in half – from 14.7 million to seven million (not shown here).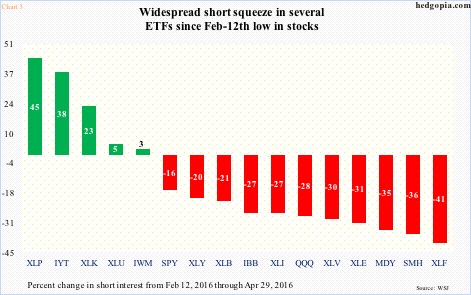
Since U.S. stocks bottomed on February 11th – or thereabouts – several ETFs have witnessed sizable reduction in short interest. Of course, there are massive outliers such as XLP, the SPDR consumer staples ETF, but all in all it is a sea of red (Chart 3).
Indices are not an exception. Since February 12th through April 29th, short interest on the NYSE composite and the Nasdaq composite went down 11 percent and seven percent, respectively (Chart 4). This was precisely the scenario equity bulls were pining for, and they got their wish. The question is, can it continue? Fuel is available. On both indices, short interest remains elevated.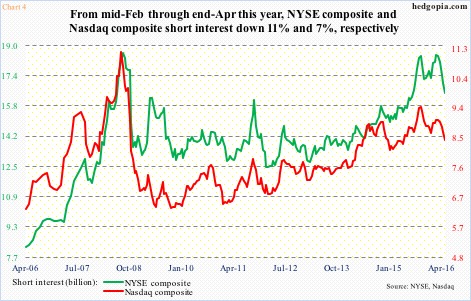
In this regard, perhaps some clues are coming from Nasdaq shorts. Of the two indices, the Nasdaq peaked earlier – April 20th versus April 27th. During the most recent reporting period, the index lost 3.3 percent, yet short interest went down 2.9 percent. In perhaps a sign that shorts concluded the decline was just about done, they covered. The index, having first gone down a tad, has essentially gone sideways since, so in this respect they have been right.
With that said, there is this to consider.
Weekly conditions are overbought on the Nasdaq, with tons of unwinding left, and several momentum indicators having already rolled over. Odds favor this continues near-term. In this scenario, Tuesday and Wednesday this week were probably a good spot to go short – just under the 50-day moving average (the 200 lies just above). Should things evolve this way, short interest likely goes up in the current period. We will find out when May 13th numbers are reported on May 24th.
Thanks for reading!
