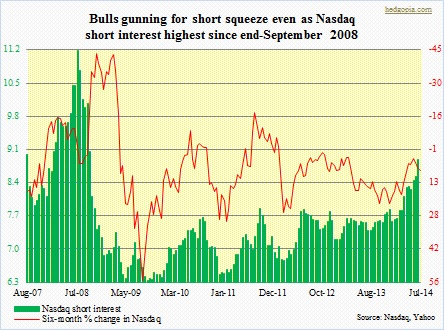
 The relentless push higher by U.S. equities is baffling, but it is what it is. All along, there has been no shortage of doubters. As a matter of fact, their ranks have consistently grown particularly this year. At the end of 2013, short interest stood at 7.6bn on the Nasdaq. By mid-June this year, it had swollen to 8.9bn – highest since end-September 2008. Year-to-date, the index has appreciated eight percent; since mid-April, it has added 13 percent. In normal circumstances, as the accompanying chart shows, a rise in short interest tends to put pressure on the index — not necessarily absolute but in the rate of change. In the chart, this is shown as decelerating six-month appreciation (percent) since mid-December last year. That changed mid-May, as the six-month change began to rise. So what is going on here? Once again in normal circumstances, as that inverted red line begins to hook down, that sets in motion a decline in short interest, and that process tends to last a while.
 In the chart above, the Nasdaq price is current, while short interest is as of the 13th of June. It is possible when the next period is reported (and the one after that), short interest would have gone down period-over-period. Should that be the case, the index probably has more upside in the days/weeks to come. This seems very counter-intuitive, given how overbought technical conditions are – short-, medium- and long-term – given how transports and small-caps are not quite in sync with what is going on in the Dow/S&P 500/Nasdaq, given how utilities, a defensive sector, is beginning to flash early signs of distribution, and given the amount of headlines – from Ukraine to Iraq – that had the potential to derail the rally but failed to do so. Bulls’ misplaced conviction or pain ahead for the shorts? Time will tell, but for now, looking at the accompanying chart and the one below, bulls can definitely go for a kill and try to squeeze shorts.
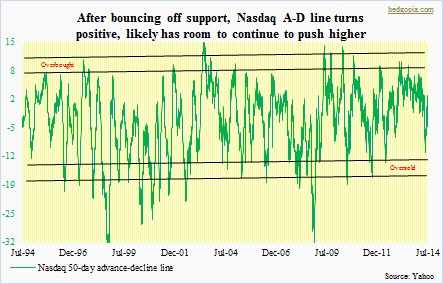
The chart above shows how the Nasdaq A-D line has managed to bounce off support. Currently, it is in positive territory – barely, though – and needs to get to 7k-10k before it gets overbought. It will be a while before it gets there, if at all. Having said that, bulls can definitely use this as potential tailwind in their quest for a short squeeze. Ditto with the chart below.