
U.S. equities continue to enjoy short-interest tailwind, but are likely to face difficulty doing so in the weeks to come.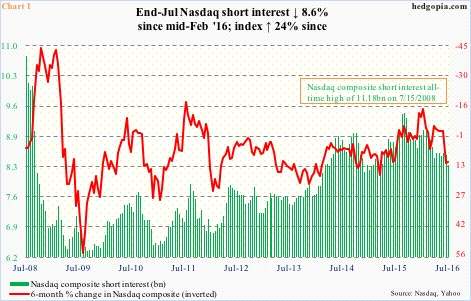
In the latest period, on an index level, short interest continued to drop. The July 15-29 two-week period saw it decline 2.4 percent sequentially on the NYSE composite and 2.5 percent on the Nasdaq composite (Chart 1). The indices were up 0.1 percent and 2.6 percent, respectively.
The S&P 500 large cap index was up 0.6 percent during the period, with short interest on SPY, the SPDR S&P 500 ETF, down 4.2 percent period-over-period. This followed a three-percent jump in the S&P 500 during the June 30-July 15 period, with the index breaking out to a new high; SPY short interest dropped 7.6 percent p/p in that period.
On the Nasdaq in particular, the 2.6-percent jump in the latest period came on the heels of a 3.9-percent rally in the prior period; back then, short interest only dropped 0.5 percent. Shorts hung in. The index was yet to break out of horizontal-line resistance going back to April 2015. The breakout took place in the just-reported July 15-29 period, likely squeezing the shorts.
In fact, this has been going on for a while now.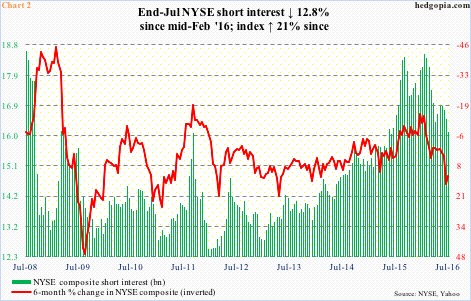
The Nasdaq composite bottomed on February 11th this year. Through yesterday’s all-time high of 5238.54, it rallied north of 24 percent. Between February 12th and July 29th, short interest fell 8.6 percent (Chart 1). Similarly, the NYSE composite rallied just north of 21 percent during the period, with short interest dropping 12.8 percent (Chart 2).
Therein lies the rub.
Despite this drop, short interest – relatively speaking – remains elevated on both indices.
Fundamentally – from dismal earnings to subdued economic activity to persistently rising valuations – there are plenty of reasons to stay short. In any other cycle, this would have been enough to drive prices lower. In this cycle, there is a new variable – central-bank activism.
The so-called Fed put emboldens market participants to buy dips/corrections, with prices persistently diverging with fundamentals. The bulls obviously hope/believe this continues. In this scenario, there is plenty of room for those green bars in both Charts 1 and 2 to continue to go lower.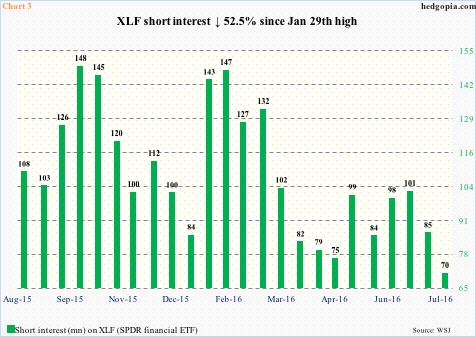
We need look no further than XLF, the SPDR financial ETF, to see what a squeeze can do to short interest. Since the February lows this year, the ETF rallied nearly 25 percent. Short interest between end-January and end-July dropped from 147 million to 70 million, down a whopping 53 percent. Longs owe a thank you note to the shorts.
It is not even worth hazarding a guess as to if those green bars in Charts 1 and 2 face the same fate. For how long would prices continue to diverge from fundamentals? In due course, it is entirely possible shorts would have the last laugh. But right here and now, they are paying the price for their bearishness.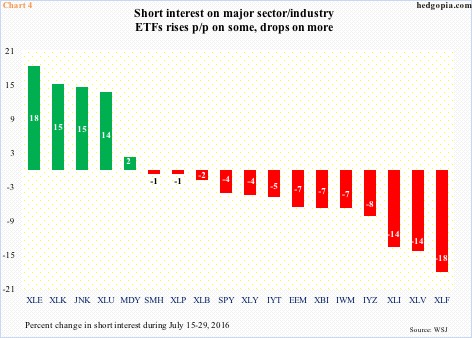
Chart 4 plots the latest p/p change in short interest on a variety of sector/industry ETFs. The red bars clearly outnumber the green ones. The bulls would like the trend to continue for sure. But with major indices up for six weeks now and tons of buying power having been expended already, it increasingly gets difficult to continue to squeeze out the shorts.
Thanks for reading!
