
Dips continue to get bought, even as volatility struggles to hold on to gains.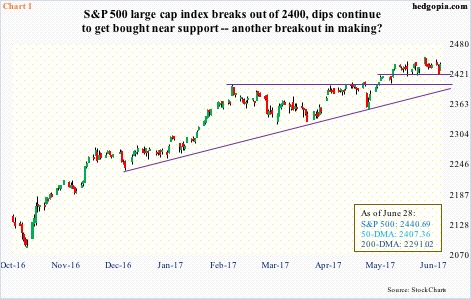
On the S&P 500 large cap index, bulls forced a break out of 2400 five weeks ago. Just a few days afterwards, the breakout was defended (Chart 1). So far this month, downward pressure has attracted bids around 2419, including Tuesday as selling stopped at that support, which, by the way, also coincided with the lower Bollinger band.
The point is, there is buying pressure, and has been that way for a while, with the index essentially sideways this month. Another breakout looming? A break out of the current range is always possible, but at least going by one indicator a major one is unlikely.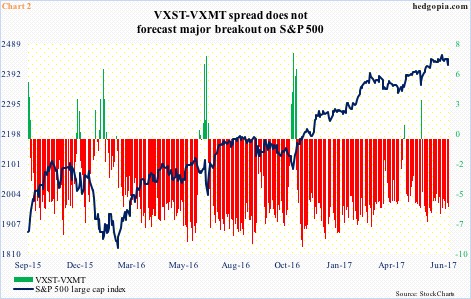
Chart 2 plots a daily spread between VXST, which measures S&P 500 volatility for nine days, and VXMT, which does the same but goes out six months.
Needless to say, volatility is missing in action in the current environment. On May 26, VXST dropped to as low as 7.51 intraday – the lowest ever in its six-plus-year history.
On Wednesday, VXST closed at 8.49, and VXMT at 14.44 – for a spread of minus 5.95.
The volatility curve – also including VIX and VXV – is in contango, although not very steep. As Chart 2 shows, stocks like when VXST-VXMT is in backwardation. The green bars represent the times when VXST is higher than VXMT, indicating near-term panic.
The last time there was a mini spike in the spread was on May 17; a day later, the S&P 500 bottomed at 2352.72.
For a sustained rally in the S&P 500, backwardation goes a long way, as negative near-term sentiment gets unwound. Not the case now.
Thanks for reading! Please share.
