
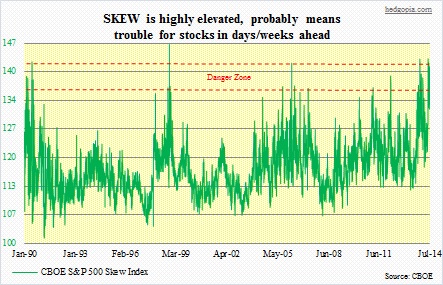
 The Chicago Board Options Exchange has been publishing values for the CBOE S&P 500 Skew Index since February 2011. The index seeks to measure the perceived risk of extreme negative moves in U.S. equity markets – the so-called tail risk. It is calculated from the prices of S&P 500 out-of-the-money options. Values range from 100 to 150. A reading of 100 indicates things are normal. As the Skew rises, so does the probability of outlier returns. The more investors perceive the risk of a “swan event” has risen, the more the demand for low-strike puts (out-of-the-money or far-out-of-the-money). This causes implied volatilities to rise. From this perspective, the Skew is similar to the VIX in that both measure risk. But on another level, it is different. The VIX measures the market’s expectation of likely daily S&P 500 returns over a 30-day time horizon, typically falling within one standard deviation around the mean return of the S&P 500. The Skew, in contrast, describes S&P 500 returns that are greater than two to three standard deviations below the mean.
 With that brief introduction, as the chart above shows, readings between 135 and 145 are rare and need to be taken seriously. Some of the prominent spikes include: 142.57 in June 1990, 135.04 in December 1997, 146.22 (all-time high) in October 1998, 127.96 in November 1999, 142.02 in March 2006, 136.15 in March 2007, 134.19 in April 2010, 136.43 in February 2011, 139.25 in March 2012, and 143.2 in December 2013. The Skew can either be a leading or coincident indicator, and each of these spikes have been accompanied by decent drops in stocks, sometimes marking significant tops. Going back a year, on December 20 last year the Skew peaked at 143.20; two days earlier, the S&P 500 peaked at 1851 and then dropped six percent in the next five weeks. On April 9 this year, the Skew peaked at 130.79. Five days prior, the S&P 500 peaked at 1897, and then quickly fell north of four percent in the next one week. The latest peak was recorded on July 3rd, when the Skew registered 142.28. The S&P 500 did make a high of 1986 that very day. That high was subsequently taken out on the 24th but the index is struggling to get back to those highs. The Skew registered another reading over 140 – 141.19 – on the 18th this month. People are willing to pay premium for out-of-the-money puts.
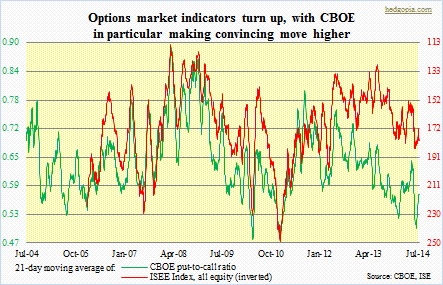
As the Skew flashes bright red, another options indicator is making a move as well. The chart above shows the 21-day moving average of the CBOE put-to-call ratio rising from extreme oversold readings. Caution: the signal coming from the ISEE is not as clear. Nevertheless, the CBOE ratio has a long way to go before it gets to overbought levels. Yes, it can always retreat and then swing higher anew, but has a lot of life left in it.
