
Small-caps have had weeks-long rest after a big rally. Are they consolidating for another leg higher or in a process of beginning a new downtrend?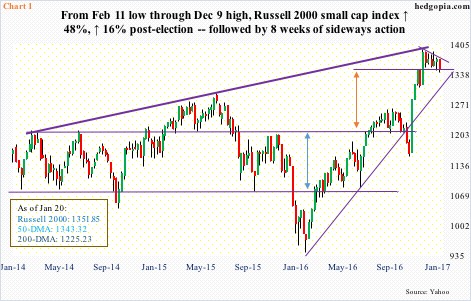
The Russell 2000 small cap index has gone flat for eight weeks now. This preceded a massive rally going all the way back to February last year, when it bottomed on the 11th. From that low through the all-time high 1392.71 on December 9, the index jumped 48 percent. On November 3, it had another important bottom, which led to a rally north of 20 percent. Post-U.S. presidential election alone, it rallied north of 16 percent!
Sideways action after such a strong move is nothing uncommon. In fact, the move post-February lows does not even have a parabolic look to it. The post-election move does – with big help from non-commercial futures traders and flows into IWM, the iShares Russell 2000 ETF.
From February 11 last year through Wednesday last week, the ETF took in $8 billion, $6.2 billion of which came in after November 8 (courtesy of ETF.com).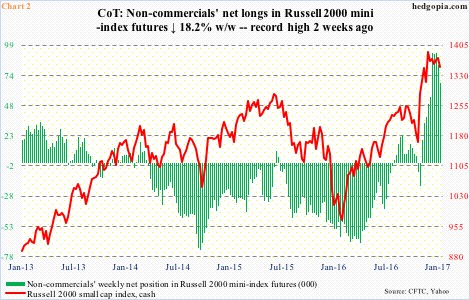
A similar phenomenon is evident in Chart 2.
In the week ended November 8 (election day), non-commercials were net short 18,999 contracts in Russell 2000 mini-index futures. Then they flipped. By January 3, they were net long 92,652 contracts. The green bars on the right side of Chart 2 have a hurried, parabolic look to it.
That is what the election did … led the majority/crowd to conclude that small-caps would benefit the most from President Donald Trump’s promise to cut taxes, deregulate and invest in infrastructure.
Thus, if the Russell 2000 is resting here, then flows need to remain on the post-election trajectory, as do non-commercials’ net longs. What are the odds of that happening? Or, better yet, what has been the trend of late?
In the week ended Wednesday last week, $512 million left IWM. This followed outflows of $60 million in the prior week. The two-week redemptions preceded inflows of $1.7 billion in the prior four.
Similarly, in the week ended last Tuesday, non-commercials reduced net longs by 15,016 contracts, to 67,394. In the prior week, they were cut by 10,242.
Here is the risk in all this.
The Russell 2000 has gone sideways in the past six weeks. From the week ended December 6 through the record high two weeks ago, non-commercials’ net longs jumped 88 percent. These holdings are just treading water – not making any money. They cannot be losing their patience. Not when the Russell 2000 is clinging on to crucial support.
Back on December 9 when the index reached that record high, the 50-day moving average lied at 1260, now it is at 1343. Arguably, the index has corrected through time, rather than price. That is one way of looking at things.
It is equally possible that – as suggested by the most recent trend in flows as well as non-commercials’ net longs – the bulls would be unable to save 1347, which they have defended thus far.
As noted above, this is where the 50-day (1343.32) lies. As seen in Chart 1, 1347 is where horizontal support lies going back to the high on November 25 last year. This is also where the rising trend line from the February 2016 low converges (briefly breached in October last year). And this is where the measured-move target of the 1080-1210 breakout lands.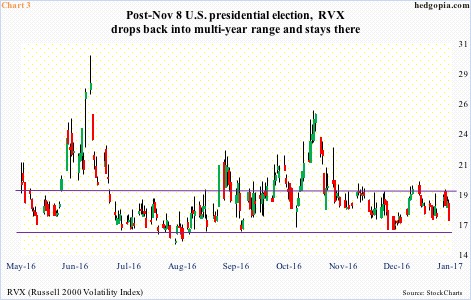
This support is being tested even as volatility has been pushed to the low end of a multi-year range. RVX, the Russell 2000 volatility index, dropped from 25.65 on November 3 to 16.96 last Friday (Chart 3).
That said, in the very near term, RVX is acting as if it wants to head lower. In this scenario, the Russell 2000 may very well go test the declining trend line from the December 9 peak (Chart 1). The 20-day moving average, now declining, lies at 1365. Medium-term, though, the path of least resistance is down – if nothing else just to unwind overbought conditions. There is a lot of complacency built into those green bars in Chart 2.
Thanks for reading!
