
There is a lot of excitement among non-commercial futures traders about spot gold’s prospects. In the 12 weeks since February 9th through May 3rd, they nearly tripled net longs in gold futures – from 98,428 to 271,648 contracts – to an all-time high (Chart 1).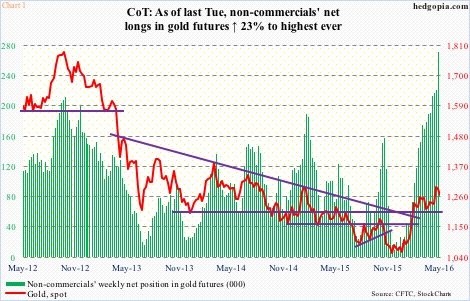
Ironically, on February 11th spot gold surged 5.6 percent intra-day before closing the session up 4.1 percent. That was also the day U.S. stocks bottomed. Gold has essentially gone sideways since. The non-commercial traders who have been aggressively building positions the past three months are yet to reap profits.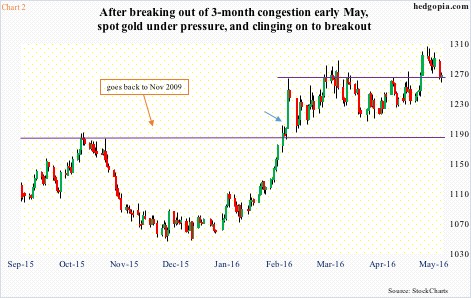
The yellow metal’s consolidation since February 11th followed a major break out of 1080-ish (blue arrow in Chart 2). This resistance goes back to November 2009. So it is possible the metal could just be consolidating before getting on a new leg higher. Or not. Time will tell.
It did rally nearly 21 percent in nine weeks before going sideways, and this did not result from some noticeable shift in fundamentals. Inflation, for example.
There is not much pricing pressure to speak of – at least going by government’s popular inflation metrics. As of March, core consumer price index (CPI) increased north of two percent for five consecutive months. Before this, the last time it increased at a two percent clip was in February 2013 (Chart 3).
Core personal consumption expenditures (PCE) – the Fed’s preferred inflation measure – is even more subdued. The 1.72-percent annual increase this February was the highest since 1.78 percent in November 2012. The last time core PCE grew with a two handle was in April 2012.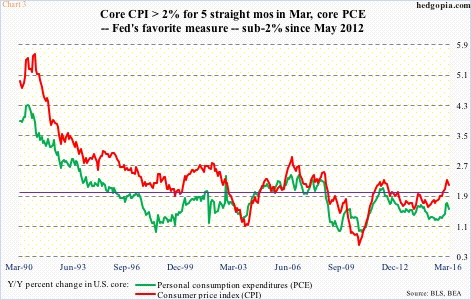
Over in Japan and the Eurozone, pricing pressure is even more suppressed, with Eurozone core consumer inflation rising 0.7 percent year-on-year in April. In Japan, core CPI rose by the same amount in March.
True both the European Central Bank and the Bank of Japan are actively stimulating their economies, with the latter deploying negative interest rates on January 29th and the former including corporate bonds in its asset purchase program.
But gold may or may not be responding to central-bank activism. It is worth recalling that the metal peaked in September 2011 shortly after QE2 ended in the U.S., and headed lower. It did rally into the start of QE3 in September 2012, and that was it. Gold made a lower high, and never got going throughout QE3.
Hence it is hard to argue gold is reacting to the ECB’s and BoJ’s stimulus programs. If anything, it is likely technical. Since that September 2011 peak, gold came in for sustained downward pressure, with some countertrend rallies along the way… the current rally being one of them.
Gold just retraced (at 1253) 23.6 percent of the September 2011-December 2015 decline. This is a Fibonacci number, and is always a good spot to pause/reverse. Hence the significance of the afore-mentioned sideways move. Should a breakout ensue, it could be massive in significance.
Flows are probably anticipating this. Through the 9th this month, GLD, the SPDR gold ETF, has attracted $1.4 billion (courtesy of ETF.com). But once again, as is the case with non-commercial futures traders, these longs are yet to reap profit.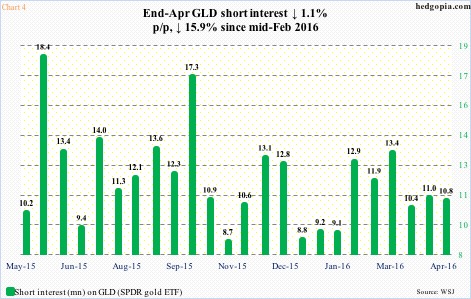
Right at this moment, shorts are indifferent. During the April 29th period, short interest on GLD went down 1.1 percent to 10.8 million – essentially unchanged in the past one month (Chart 4). Shorts are not getting aggressive, and that could mean lesser fuel for squeeze should gold manage to break out.
The risk going forward is this.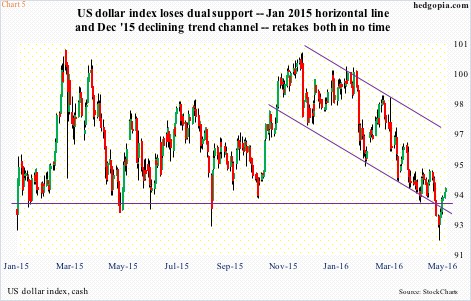
The US dollar index is trying hard to stabilize. Since early last year, it had essentially been trapped in a rectangle, with the lower end at 92.50-93. It recently lost that support, which also approximated five-month channel support (Chart 5).
However, with a May 3rd hammer and subsequent five straight up sessions, the dollar index has wrestled its way back above support-turned-resistance-turned-support. Where it goes from here will have huge implications for gold, and whether or not the latter breaks out.
On a weekly basis, the dollar index (94.27) remains grossly oversold, even as spot gold (1,267.3) is way overbought. Unwinding of these conditions will begin sooner or later.
Thanks for reading!
