
Oil bulls must have breathed a heavy sigh of relief on Tuesday as crucial support held. But would the U.S. dollar poop the crude party?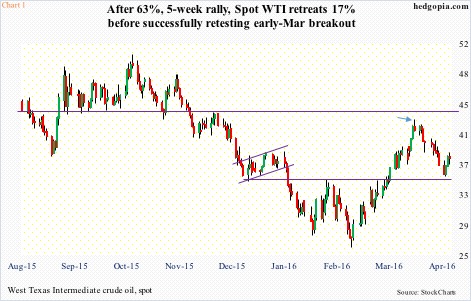
On its way to collapsing 76 percent since June 2014 through the February 11th low, spot West Texas Intermediate crude ($37.53) broke many supports, one of which was $34.50-$35. That level was unsuccessfully tested several times in January and February before it broke out early March (Chart 1).
The WTI surged 63 percent in five weeks before getting rejected at its declining 200-day moving average on March 18th. It dropped 17 percent since that high (arrow in Chart 1), before finding support. Where did the buy orders start streaming in? At that afore-mentioned price point.
The $34.50-$35 level has been a price point around which bulls and bears have actively dueled going back to 2000.
On Tuesday, the crude tagged the lower Bollinger Band (daily), made a low of $35.24 and bounced. Right below was now-slightly rising 50-day moving average ($34.87). The next day, in a high-volume session, it rallied more. News of crude stocks helped.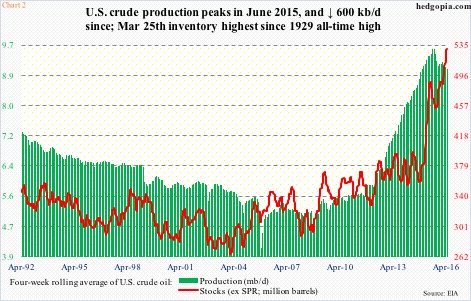
In the week ended last Friday, crude stocks fell by 4.9 million barrels to 529.9 million barrels. Crude production fell, too – by 18,000 barrels per day, to nine mb/d. From the June 5th (2015) high of 9.61 mb/d, production has now fallen by over 600,000 b/d.
Consequently, in Chart 2, the green bars – a four-week rolling average of production – have come under pressure. That said, about four years ago, they began a parabolic rise.
As well, the red line in Chart 2 – a four-week rolling average of stocks – is at a new high.
Just prior to the afore-mentioned 4.9-million-barrel drop, crude inventory reached a record 534.8 million barrels, which was the highest since the all-time high 545 million barrels in 1929.
Medium-term, Chart 2 should continue to create a ceiling for crude price. Near-term, successful defense of that $34.50-$35 support is a positive. There is room to rally on a daily chart. With a slight twist.
The dollar can potentially create a problem.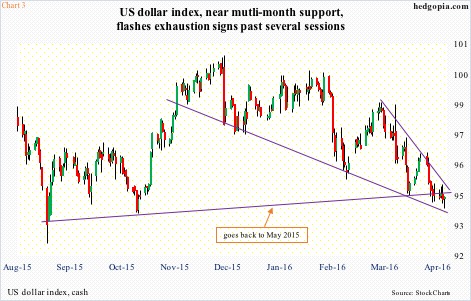
After a nine-month, 25-percent rally into the March 2015 peak, the US dollar index (94.50) pretty much went sideways before trading along a declining trend line since last December (Chart 3).
On both daily and weekly basis, the dollar index remains oversold, particularly the former. For the past several sessions, it has traded around a May 2015 slightly-rising trend line, with several dojis. The index formed a death cross on March 31st, and has only gone sideways since.
The odds of a rally are growing. At least near-term. And that has the potential to negatively impact the price of crude.
Medium- to long-term, non-commercial futures traders will probably decide which way the dollar index is headed, hence by default the price of crude.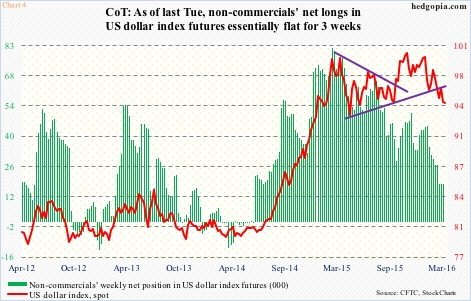
In Chart 4, the red line and green bars track each other very well. Back in March last year, these traders’ net longs peaked at 81,270 contracts. The dollar index peaked a week later. Net longs continued to shrink, and the index followed suit.
For the past three weeks, the green bars have gone sideways in the 17,000-plus range. This week’s reading can be a big tell (will be published later this afternoon).
If these traders are convinced that the afore-mentioned exhaustion signs on the dollar index’s daily chart are signaling an impending rally, they would probably begin to add to net longs. A rally in the dollar – notwithstanding the duration – is bad news to the crude.
Thanks for reading!
