
To say that SPY, the SPDR S&P 500 ETF, has been volatile in recent weeks is an understatement.
Intra-day, between the December 29th high and the January 20th low, the ETF shed nearly 13 percent… in 15 sessions. Like that. Off that low through February 1st intra-day high, it then rallied 7.5 percent… in nine sessions. This was then followed by another 7.7-percent rally between February 11th and the intra-day high this Monday (Chart 1).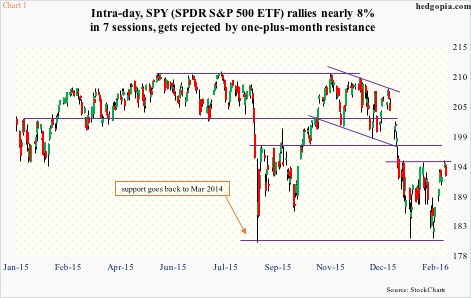
For the nimble ones, this meant plenty of opportunities.
The February 11th low in particular – which retested the January 20th low – was a perfect time to at least sell some puts.
Now time may be ripe to do the opposite – sell some calls.
On Monday, SPY tagged its declining 50-day moving average. Besides, this was the third time the ETF was trying to take out resistance at 195 (prior two tries being January 13th and February 1st). A horizontal line around 195 can be drawn all the way back to August 2014. This level has some meaning.
A convincing break here is for sure to bring up chatter of completion of a W formation… a double bottom. Given the significance of this level, there likely are tons of stops, which, if taken out, can unleash buying pressure. So in a best-case scenario, if SPY breaks out of 195, the risk for shorts is a quick move toward 197-198, where resistance is massive (Chart 1).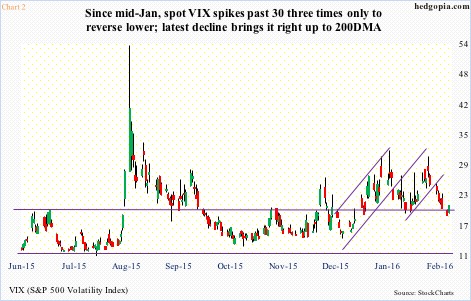
Even as SPY was testing 195, spot VIX came within inches from testing its 200-day moving average (18.29). In fact, it dropped to 19.02 on Monday, before rallying yesterday. The last time VIX traded below this average was on December 29th, which is when stocks began to come under pressure.
VIX’s latest drop began after the spike-reversal signal on February 11th (Chart 2). Since mid-January, spot VIX spiked past 30 three times, each time right outside the upper Bollinger Band, and on each occasion it marked a short-term peak.
With a seven-day, nearly 12-point drop, VIX’s daily conditions are now oversold. This is as good a spot as any for volatility bulls to step up and defend. This likely happens.
As stated earlier, the S&P 500 rallied nearly eight percent in seven sessions. In normal circumstances, this should have been enough to ignite risk-on trades. Yet, spot VIX (20.98) is finding buyers near 20. And XLP, the SPDR Consumer Cyclicals ETF, closed yesterday near its all-time high of late December last year.
It is time to hypothetically sell some SPY ($192.32) calls, and be ready to go short, if the need be.
Naked calls are inherently risky. But in this case in the event 195 gets taken out, there is much bigger resistance at 197-198. Selling March 4th 193.50 calls for $1.77 ensures going short at $195.27, should they be assigned – less than two points lower than the lower bound of 197-198 resistance.
Thanks for reading!
