
It is that time of the year again. Time to ponder the January effect. The adage that postulates that as goes January so goes the year.
Last year, the January effect did not quite pan out. The S&P 500 large cap index was down 5.1 percent in January (down nine percent at one time), but the year ended up in the green, up 9.5 percent. Granted most of that return came post-U.S. presidential election (November 9), but it was a decisively up year.
In the current bull market that began in March 2009, this was the fourth year in which January was down but the year ended up in the green – the other being 2009, 2010, and 2014.
With that said, several other similar maxims did not work either in 2016.
Sell in May and go away, for instance. Stocks historically have weaker returns from May to October than they do from November to April. Hence investor temptation to sell in May. But between May and October last year, the S&P 500 was up 2.9 percent.
Or, take the Santa Claus rally, which falls in the week between Christmas and New Year’s Day. In 2016, the S&P 500 was down 0.3 percent during that time.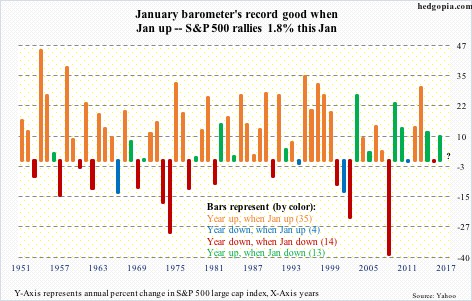
Importantly, when January is down, January effect’s record is spotty to begin with.
The chart above plots year-over-year change in the S&P 500 going back to 1951. Hence, through 2016, there are 66 data points. The color-coded bars have been divided into four groups: (1) years that were up when January was up, (2) years that were down when January was up, (3) years that were down when January was down, and (4) years that were up when January was down. In parenthesis is the number of years for each group.
The signal is clearly strong when January is up. Of the 66 (2017 is a question mark), there have only been four years in which the year ended down with January up. The last time this took place was in 2011, with the S&P 500 down but essentially flat.
Of the 66, January is up 39 times. That is nearly three-fifths of the total.
But here is the thing. Of the years in which January is up, 90 percent of the time the year ends up in the green. The orange bars simply jump out in the chart.
As far as 2016 went, it could have gone either way. Prior to last year, of the 26 years in which January was down, 14 ended in the red, and 12 in the green. Pretty much a coin toss. In other words, 2016 could have gone either way, and it did.
Odds, however, are much more favorable this year.
Thanks for reading!
