
- Sell-side S&P 500 revenue growth estimates for 2015 goes negative
- High correlation between SPX revenues and U.S. nominal GDP
- 2015 U.S. GDP estimates in 3% range way too optimistic?
The 443 S&P 500 companies that have reported 4Q were tracking 3.5-percent growth in earnings, FactSet told us in its earnings report this past Friday. This is better than the 1.7-percent estimate at the end of December but much worse than the 8.3 percent expected at the end of September.
Earnings-growth estimates for 2015 are now 2.9 percent, down from 8.2 percent as recently as December-end. 2015 had been trending lower for a while now, so this is nothing new. But in that report, there was one particular data point that was worth paying attention to.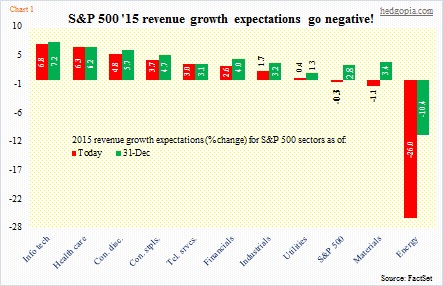
As of the end of December, S&P 500 companies were expected to grow revenues 2.8 percent in 2015. This has now gone negative (Chart 1). The main culprit, of course, is what is on the far right of the chart – energy. Revenues are expected to now shrink 26 percent in the sector, versus expectations for a 10.4-percent drop back then. Given what is transpiring in oil, this should not come as a surprise. What is rather shocking is what is happening in other sectors.
Except for health care, growth expectations are now lower in all the remaining eight sectors. This runs in total contrast with the prevailing narrative that a lower oil price hurts oil players but helps the rest of the economy. There are some that seek to justify the drop in earnings saying it is all due to energy. That argument just falls flat on face, looking at Chart 1.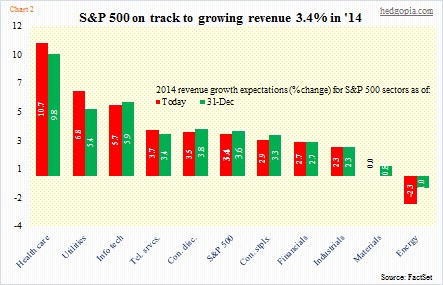
Here is the irony. The sharp deceleration in 2015 revenue-growth expectations comes on the heels of decent growth in 2014. With a little less than 90 percent of S&P 500 companies having reported 4Q, 2014 is on track for 3.4 percent growth on the top line – down from 3.6 percent expected at December-end (Chart 2), nevertheless it is a decent growth rate.
So if we are to trust sell-side estimates, the revenue growth rate is set to decelerate from 3.4 percent to a negative 0.3 percent.
Here is an even bigger irony.
Sales for S&P 500 companies closely track U.S. GDP (Chart 3). In 2013, the U.S. accounted for 67 percent of S&P 500 revenues. In most of the countries that account for the remaining 33 percent, economic growth is slowing. The World Bank says the global economy will expand three percent this year, versus its projection of 3.4 percent in June last year. But this deceleration in activity outside the U.S. cannot solely account for the sharp revision downward in expectations for S&P 500 revenue growth. And this is important. The chart only has 60 quarters of data, but look at the R between the variables – a very high .95.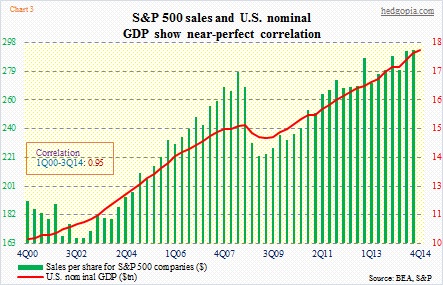
Here are some of the estimates for U.S. GDP growth this year.
The World Bank expects the U.S. economy to expand 3.2 percent and the IMF 3.6 percent. Both are higher than the consensus 2.9 percent. For reference, the economy grew 2.4 percent in 2014. So things are expected to accelerate this year. By the way, in Chart 3, nominal GDP is used, while the estimates from these various organizations are real.
So the question is: What are we supposed to believe? Revenue estimates of sell-side analysts for S&P 500 companies or economists’ GDP estimates? The former is an evolving story, thanks primarily to what is going on in the oil complex. These also probably reflect management commentary during most recent earnings calls. If this means we need to give more weight to S&P 500 revenue expectations, then it is only a matter of time before economists take an ax to their GDP estimates.
