
- 2nd straight M/M rise in orders for U.S. business capX proxy in April
- For several months beginning June, hurdle rate quite high for Y/Y growth
- Six years into expansion, ZIRP probably not confidence booster among CEOs
Phew!
A sigh of relief to see much-better-than-expected order numbers for U.S. core capex in April. Non-defense capital goods ex-aircraft is a proxy for corporate capital expenditures, hence an important metric to keep an eye on.
In April, these orders were up one percent month-over-month, to $69.1 billion, versus expectations for 0.3 percent growth. This comes on the heels of 1.5 percent increase in March. February was awful, down 5.1 percent. Year-over-year, April orders were down 1.4 percent. This is the third consecutive month of down y/y numbers, but the intensity of the decline has been decreasing; February was down 3.4 percent (Chart 1).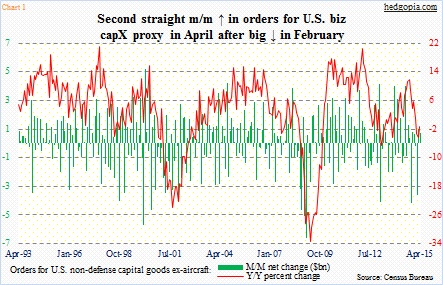
Yesterday’s was the advance report. Revised and detailed estimates will be out on June 2nd.
Speaking of revision, there was a huge revision in March.
Before the revision, m/m orders had been down for seven consecutive months (old post here). Now, things do not look as gloomy. After the revision, of those seven months, four were up and three down. Back then, orders decidedly had a downward bias. Now, it is more like neutral.
Nonetheless it must be pointed out that orders are still substantially below the September high of $74 billion. Before the revision, orders peaked in August at $73.1 billion.
Post-revision, there has also been an improvement in the inventories-to-orders ratio. It rose from 1.64 last September to 1.80 in February, and has since dropped to 1.78 in March and 1.76 in April (Chart 2). On an absolute level, inventories were at an all-time high of $121.7 billion in April, but have grown at a much slower rate than orders the past couple of months.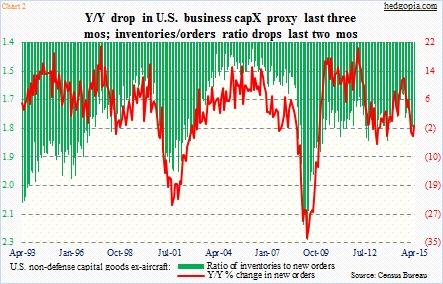
Going forward, as far as y/y growth is concerned, May has a good shot, as last year orders were $69.2 billion. But then the hurdle rate steepens. In June-September last year, orders were in the $72- to $73-billion range. So unless things really pick up steam in the next few months, the hurdle rate is quite high.
This is especially so considering that in 1Q15 non-residential fixed investment suffered its first decline (down 3.4 percent) since 1Q11 (down 0.9 percent). During the quarter, this component took away 0.44 percent from real GDP growth (Chart 3).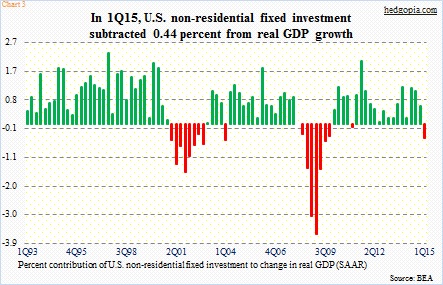
In the meantime, we are beginning to hear commentaries around how oil rallied nearly 50 percent from its mid-March trough to early-May high and how that should lead oil companies to loosen the purse strings. It may not be so simple. Early this month, both CHK and DVN, for instance, raised oil output forecast for the year. However, the former kept its full-year capX guidance unchanged at $3.5 billion-$4 billion. And the latter cut its by $250 million to $3.9 billion-$4.1 billion.
No doubt, the collapse in the price of oil since the middle of last year has not helped the U.S. capX scene. But this is recent. Throughout this cycle, businesses have lacked the capX aggression they showed in past cycles. Chart 4 is apropos. Since December 2008, the correlation between National Federation of Independent Business members’ capX plans and the Fed funds rate has broken down.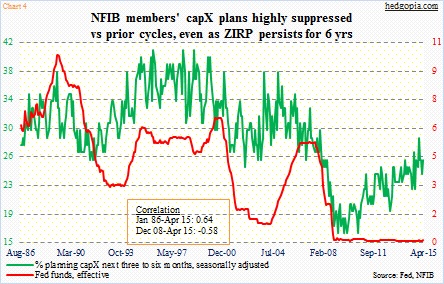
Makes you wonder, have rates stayed too low for too long? Zero interest-rate policy is essentially telling these businesses that we continue to be in crisis mode. This is despite the fact that the nation’s capacity utilization rate rose from 66.9 in June 2009 (when Great Recession ended) to 79.8 last November.
Sure, GDP growth is sub-par, and wages are stagnant, and they need to improve. But these ultra-low rates six years into expansion probably do not help build confidence among CEOs.
Thanks for reading!
