
Last Friday, the first print of 3Q16 GDP was published. Real GDP grew at an annualized rate of 2.9 percent. Inventory contributed 0.61 percent to this growth, snapping five consecutive quarters of negative contribution.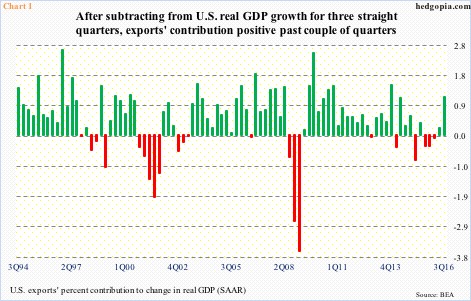
Similarly, exports’ contribution jumped to 1.17 percent, up from 0.21 percent in 2Q16. In the three quarters before that, exports subtracted from growth (Chart 1).
The point is, the 2.9-percent headline number looks a little stronger than is the case. That said, this was the highest growth rate since 3Q14, and comes on the heels of 1.4 percent in 2Q16, 0.8 percent in 1Q16 and 0.9 percent 4Q15.
On Friday, the 10-year yield rallied to 1.88 percent before closing at 1.85 percent. The US dollar index (cash) opened higher a tad but closed down 0.5 percent to 98.34 (Chart 2).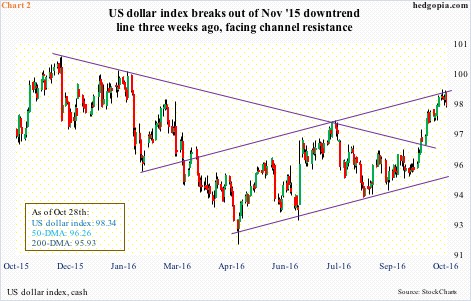
A case of fatigue setting in?
Probably.
From the May 2016 low through the Tuesday high of 99.09, the dollar index rallied nearly eight percent. That is in less than six months – a big move for any currency. As a result, daily and weekly conditions are grossly overbought.
Plus, since the May low, it has been trading within an ascending channel. In early this month, it broke out of a declining trend line drawn from November last year (Chart 2). That high unsuccessfully tested the high from March last year, before dropping to the May low. The rally post-October breakout puts the dollar index right at the top end of the channel.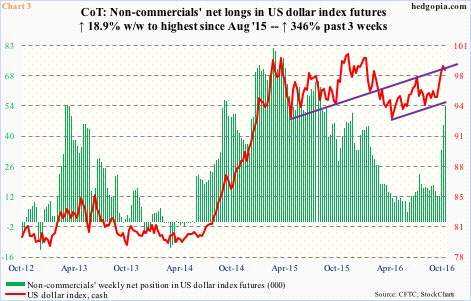
Last week, the dollar index fell 0.35 percent … after three straight weekly increase. At one point last week, it was up 0.4 percent for the week, but could not hang on to the gains. This was also a week non-commercials continued to add to net longs in US dollar index futures.
In the three weeks through Tuesday last week, their holdings went up from 12,100 contracts to 53,990 (Chart 3); the dollar index rallied 3.1 percent during the period. Too soon to say if the mini-reversal in the cash last week would prompt these traders to begin to cut back, but odds are rising.
As noted above, the dollar index remains heavily overbought, unwinding of which is just a matter of time. The lower end of the channel it is in will not be tested until 95.5, so it remains in an uptrend (Chart 2). For now, though, daily momentum indicators have turned lower, with 97.60 the nearest support.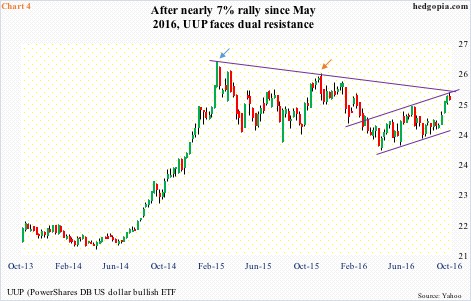
The corresponding support on UUP, the PowerShares DB US dollar bullish ETF (25.41), lies at 25.23, which also approximates the 20-day moving average, which is still rising; dollar bulls will probably try to defend this. In due course, if UUP proceeds to test the lower end of the channel it is in, we are talking 24.60 (Chart 4). The 200-day moving average lies at 24.84, and the 50-day at 24.89.
Chart 4 uses weekly prices, and goes back three years. The blue and orange arrows correspond to the peaks in March and November last year, respectively. A trend line drawn from the March peak converges with the upper end of the channel it is in. The dollar index has exactly the same setup (Chart 2 does not go as far back as Chart 4 does).
One of the ways to play this would have been by use of options. But there is not much premium. Weekly November 4th UUP 25.50 calls merely bring $0.07. Deploying naked calls does not help, or spreads for that matter.
Potential shorts can use the underlying – UUP. Risk/reward dynamics are in their favor – at least near term.
Thanks for reading!
