
Chart 1 in yesterday’s post drew many e-mail responses, some of which were critical. Critical because the post used a trailing price to earnings (P/E) for the S&P 500 index, rather than forward.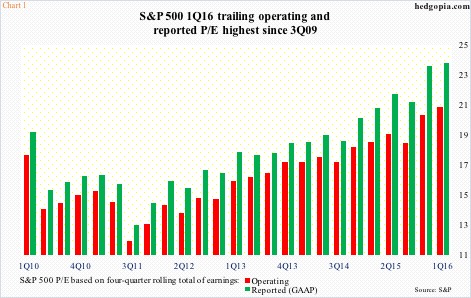
To refresh, the chart used a four-quarter rolling total of trailing operating and reported earnings. In 1Q16, they respectively were $98.61 and $86.44, versus a peak of $114.51 and $105.96 in 3Q14, in that order. Between the periods, the S&P 500 was nearly 90 points higher.
A rise in the numerator and a drop in the denominator do not make for cheap P/E, which in 1Q16 stood at 20.9x operating and 23.8x reported earnings – the highest since 3Q09.
These are expensive multiples, which is bound to discourage many a value-conscious investor. The bull market is already seven years old.
But what happens if we use forward earnings? The picture changes – for the better.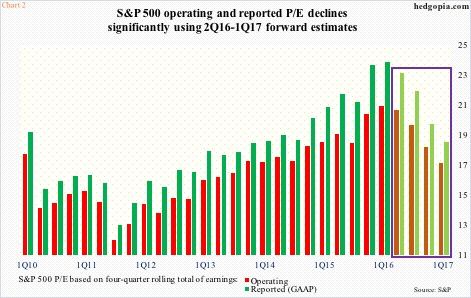
Chart 2 is a replica of Chart 1 except it adds four more quarters (violet box). Up until 1Q16, Chart 2 uses trailing earnings, as does Chart 1, then it uses consensus estimates for 2Q16-1Q17. Using forward estimates, the P/E ratio drops meaningfully for these four quarters. For instance, 1Q17 operating P/E drops to 17.1 and reported to 18.5. This is still not cheap by historical standards, but much more reasonable than 1Q16 multiples using trailing four quarters.
In ideal circumstances – when things are normal – use of forward estimates makes sense. Trailing is past. Prices do – and should – key off of future expectations. Assuming, of course, the cycle is normal. The current one is anything but. Hence the question, how reliable are these estimates?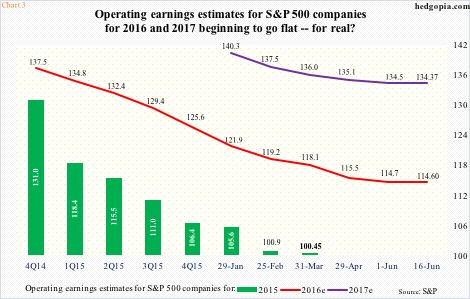
For reference, actual operating earnings for S&P 500 companies for 2015 came in at $100.45, down from $113.02 in 2014, for a decline of 11.1 percent. However, at the end of 2Q14, 2015 estimates were as high as $137.50 (no typo); if realized, 2015 earnings would have grown by a hefty 21.7 percent. That was not to be. Estimates were constantly revised downward (Chart 3).
Thus far, this is also true with 2016. At the end of 4Q14, operating estimates were $137.50. Then the knife came out. The red line in Chart 3 began its journey from top left corner to bottom right – otherwise known as downward revision. By June 16th this year, 2016 had been cut to $114.60. Along the same lines, 2017 started out at $141.11 in the middle of January this year, and was down to $134.37 by June 16th.
The point is, the revision trend in the past several quarters has been decidedly downward. Hence the difficulty in using forward earnings as a guidepost.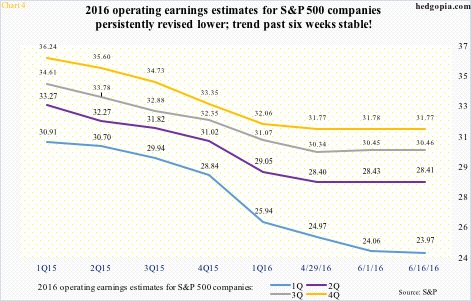
Here is the rub. As elevated as operating estimates are for the remaining three quarters of 2016 versus what was earned in the corresponding quarters last year, they are beginning to go flat (Chart 4).
By June 16th, 2Q16 estimates stood at $28.41, versus actual $26.14 in 2Q15. Similarly, 3Q16 was $30.46, versus $25.44 in 3Q15; and 4Q16 $31.77, versus $23.06 in 4Q15. Both 2016 and 2017 estimates are beginning to go flat as well (Chart 3). Should investors put faith in 2017 estimates in particular, as elevated as they seem?
The overriding assumption in all this is that oil has bottomed and that the US dollar index has peaked. This may or may not turn out to be true. Time will tell. What we do know is this. When 2015 and/or 2016 estimates were first issued, they apparently built in lots of assumptions, which apparently were not met, resulting in downward revision.
The current cycle is atypical in many respects. The persistent downward revision in earnings estimates is one of them. Use of trailing earnings befits the moment.
Thanks for reading!
